Protocol testing and the simulator
Use the protocol tester to get a real reading from an SNMP or Modbus TCP device, and use the device simulator to exercise the dashboard and alerts with sample data, without real equipment.
«تنظیمات» ← «تنظیمات پروژه» ← «تستر پروتکل»؛ «طراحی سیستم» ← «شبیهساز دستگاهها» — «تنظیمات» ← «تنظیمات پروژه» ← «تستر پروتکل»؛ «طراحی سیستم» ← «شبیهساز دستگاهها» — Settings → Project Settings → Protocol Tester; System Design → Device Simulator
This lesson's two tools answer two different questions. The protocol tester asks, "Does the real equipment respond right now, and what value does it return?" The device simulator asks, "If data comes in, are the dashboard and status colors displayed correctly?" The two are not substitutes for each other.
Get to know the page: protocol tester
The "Device Protocol Tester" page opens with the subtitle "Send a real poll to SNMP or Modbus TCP and show the live response + every OID/Register". This page requires view access to project settings.
| Section | Purpose |
|---|---|
| دستگاه (Device) | A searchable list; only SNMP and Modbus devices are shown in it |
| اجرای تست (Run Test) | Sends one real reading |
| Result card | A "Success" or "Failed" chip and a table of Name, OID or Register, Type, Value, Last Updated |
| تستهای اخیر (Recent Tests) | The last five runs; appears from the second run onward |
Step by step: protocol tester
- Open the page. Go to «تنظیمات» ← «تنظیمات پروژه» ← «تستر پروتکل» («» ← « » ← « » (Settings → Project Settings → Protocol Tester)).
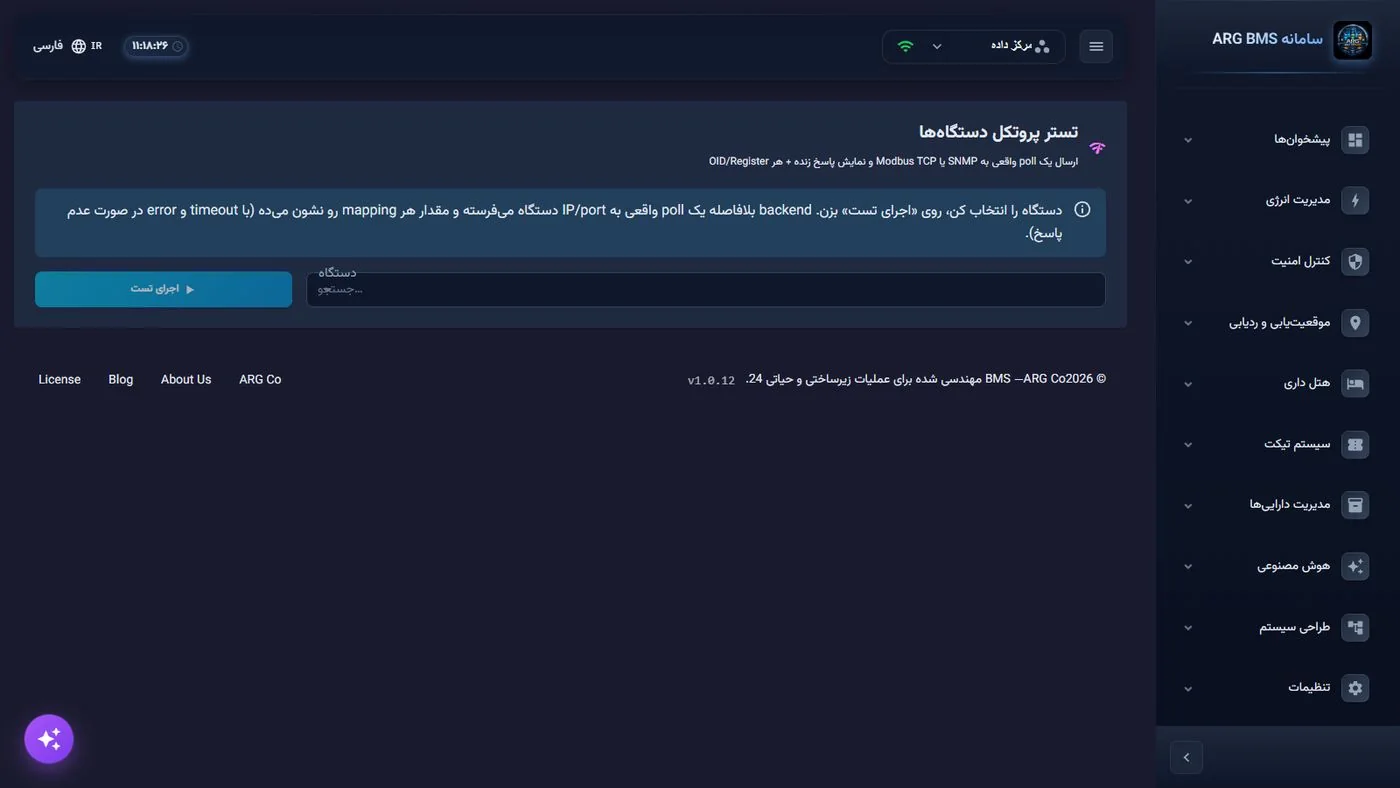
Protocol Tester · The device field and the Run Test button - Select the device. In the دستگاه field, type a few letters of the name and select the device. There is no field for entering an OID or register; the tester reads the same mappings already defined for the device.
- Run the test. Click اجرای تست. While running, "Testing…" is shown.
- Read the result. A green value means a response was received; "No value" means no response came for that mapping; an "Error" chip with a hover hint means the request to the server itself failed. Compare the values against the equipment's own display.
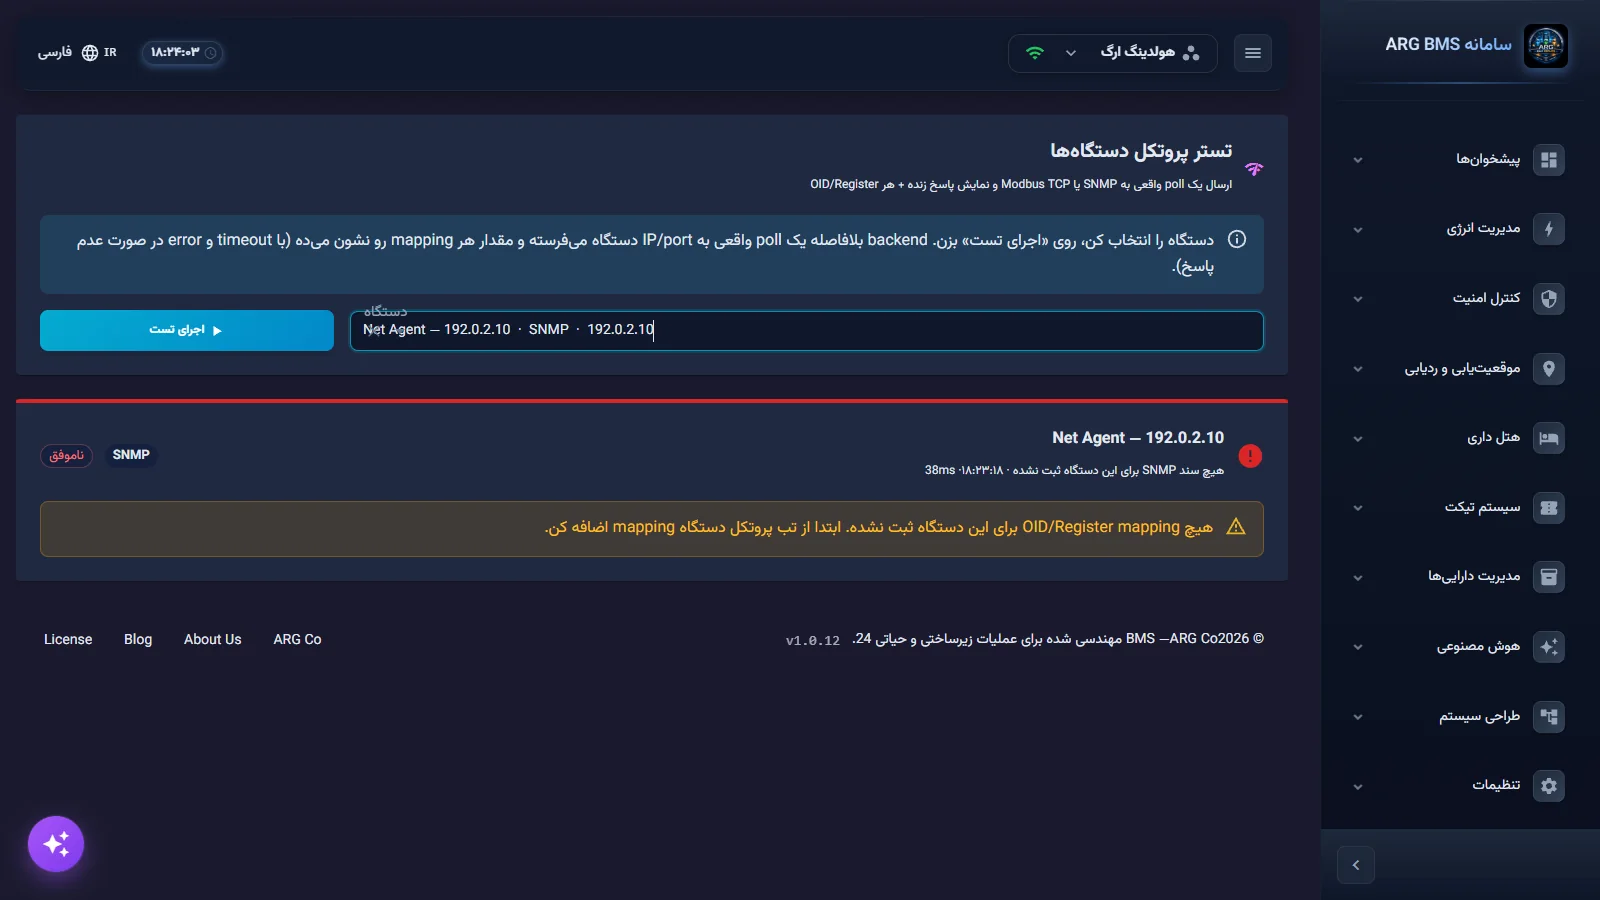
Test result · Example of a failed result: a device that still has no OID or register mapping
Get to know the page: device simulator
The "Device Data Simulator" page has a "Simulation and Load Test Console" panel with a همگامسازی پروژه (Sync Project) button, six indicator cards, a "Project Devices" list (filters for all, active, with variables, without variables), a "Device Variables" table, and a "Live Events" panel. Test profiles:
| Profile | Rate | Duration |
|---|---|---|
| Quick check | 250 per second | 30 seconds |
| Normal load (default) | 1000 per second | 60 seconds |
| Safe heavy load | 4500 per second | 120 seconds |
| Custom | Via "send interval" and "test duration" | Custom |
Step by step: device simulator
- Open the page. «طراحی سیستم» ← «شبیهساز دستگاهها» (« » ← « » (System Design → Device Simulator)). The current project syncs automatically; if the list stays empty, click همگامسازی پروژه.
- Select the device. From "Project Devices", select a device that has a variable. The شبیهسازی پیوسته (Continuous Simulation) toggle turns on continuous sending, and ارسال لحظهای (Send Instantly) sends one value right away.
- Set each variable's pattern. In the "Device Variables" table, choose a pattern for each variable: constant, sine wave, random, linear, or alert spike; and set the minimum and maximum. The "Generate" column's toggle determines whether that variable takes part in the test. Use متغیر جدید (New Variable) to add a test variable.
- Run the test. Select پروفایل آزمون (Test Profile) and click شروع آزمون (Start Test). Open the relevant dashboard in another tab and watch the values and status colors (disabled, normal, caution, danger, error) change. When finished, click توقف آزمون (Stop Test).
Which tool for which question
| Question | Tool | What it proves |
|---|---|---|
| Does the equipment respond on the network? | Protocol tester | The network path, community or unit ID, and mappings are correct |
| Is the value read correctly? | Protocol tester + equipment display | The factor, offset, and byte order are correct |
| Are the dashboard and status colors correct? | Device simulator | Display, limits, and color coding are configured correctly |
| Does the system tolerate the expected load? | Device simulator, test profiles | System behavior at high data rates |
Recommended sequence during setup: first define the device and its points, then run a protocol test to confirm a real reading, and finally run a short simulator session to check display and alerts before handing off to the operator.
SCADA simulator
To test a SCADA scenario, open the simulator from the list of SCADA scenarios and for that specific scenario; opening it without a scenario gives the message "No scenario ID specified". This simulator has start, pause/resume, end, and reset buttons, a speed slider from 0.5x to 5x, and the panels "Sensors (input)", "Actuators (output)", and "Run log", and it runs entirely in the browser with sample data.
Tips and common mistakes
- If you see the message "No OID/Register mapping registered for this device…", build the device's points first (lessons B3 and B4).
- Take the simulator's standing message seriously ("Data is simulated; this is not a real observation or an SNMP connectivity test…"); a correct display in the simulator does not prove the real equipment is connected.
- شروع آزمون is disabled when no variable is active, and the profile cannot be changed while running.
- For rates above roughly 4667 per second, a warning message and a confirmation prompt are shown; use the ready-made profiles in a production environment.
Summary
- Protocol tester: a real SNMP or Modbus TCP reading from the device's existing mappings.
- Device simulator: sample data for testing the dashboard and alerts, with no effect on the equipment or its history.
- The "Normal load" profile is 1000 per second for 60 seconds.
- The SCADA simulator opens from the scenario list, for one specific scenario.
Hands-on exercise on the live demo
On the public demo, do not change device settings.
- In تستر پروتکل (Protocol Tester), select an SNMP device and click اجرای تست. Note the result chip's status and the number of rows.
- In شبیهساز دستگاهها (Device Simulator), select a UPS device and review the "Device Variables" table. If the demo account allowed running it, set one variable's pattern to "sine wave" and run the "Quick check" profile; otherwise, go as far as the profile-selection step.
- Explain why the tester's result might differ from what the simulator shows on the dashboard.
Lesson check
Answer at least 3 of 4 correctly to pass.
- 1. Which protocols does the protocol tester support?
- 2. What does the device simulator do to real equipment?
- 3. What is the rate of the "Normal load" profile?
- 4. What is the tester's maximum wait time for an SNMP response?