Building a 2D Dashboard
Build a 2D dashboard, place elements from the palette onto the canvas, adjust their appearance and layout, and save, duplicate, export, or delete the dashboard.
«طراحی سیستم» ← «طراحی داشبورد» ← «داشبوردهای من» ← «داشبورد جدید» — «طراحی سیستم» ← «طراحی داشبورد» ← «داشبوردهای من» ← «داشبورد جدید» — «طراحی سیستم» ← «طراحی داشبورد» ← «داشبوردهای من» ← «داشبورد جدید» — System Design → Dashboard Design → My Dashboards → New Dashboard
A 2D dashboard is the most common operating view: a canvas on which text, live point values, charts, gauges, command buttons, and floor-plan images are arranged together. In this lesson you build a 2D dashboard, place elements from the palette onto the canvas, adjust their appearance and layout, and save, duplicate, export, or delete the dashboard. Connecting elements to data and commands is covered in the next lesson (B9).
Get to know the screen
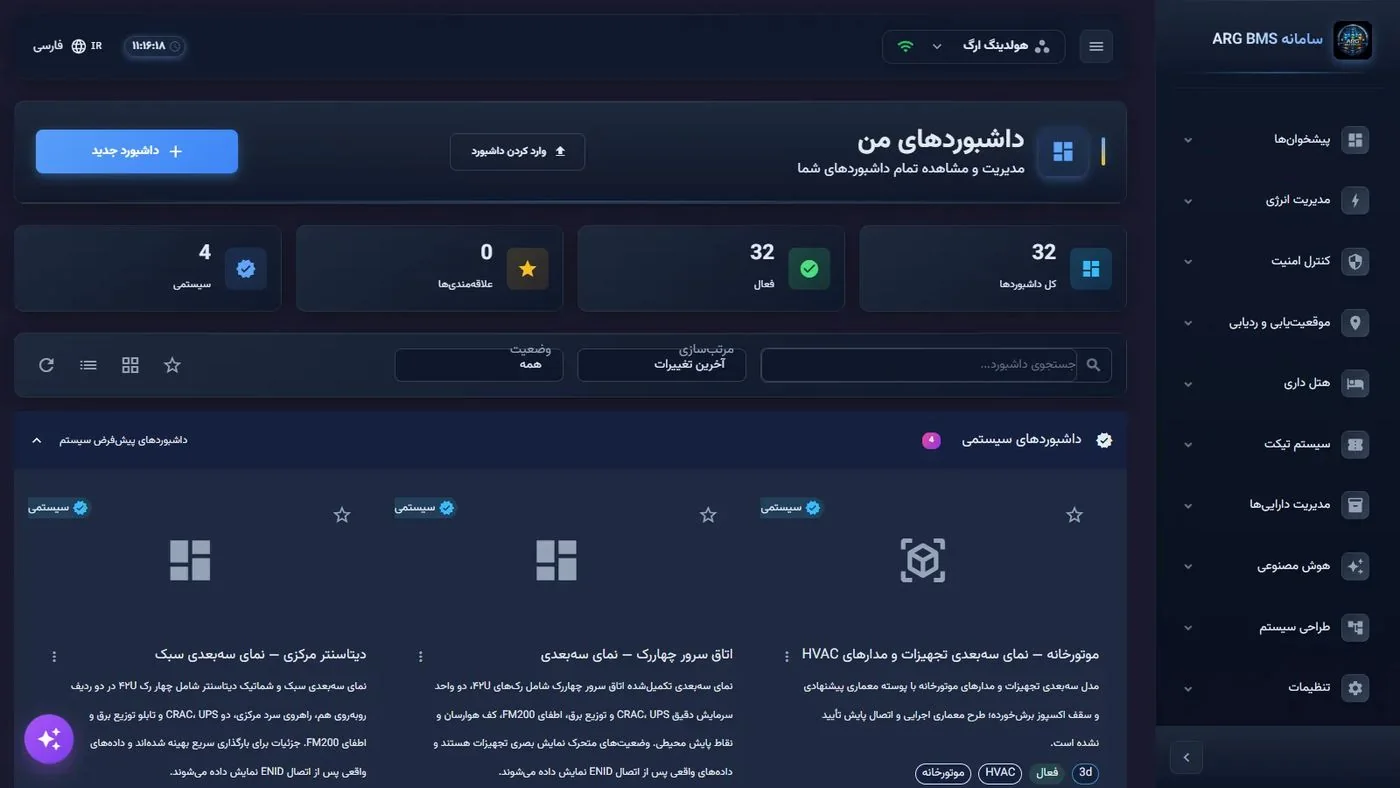
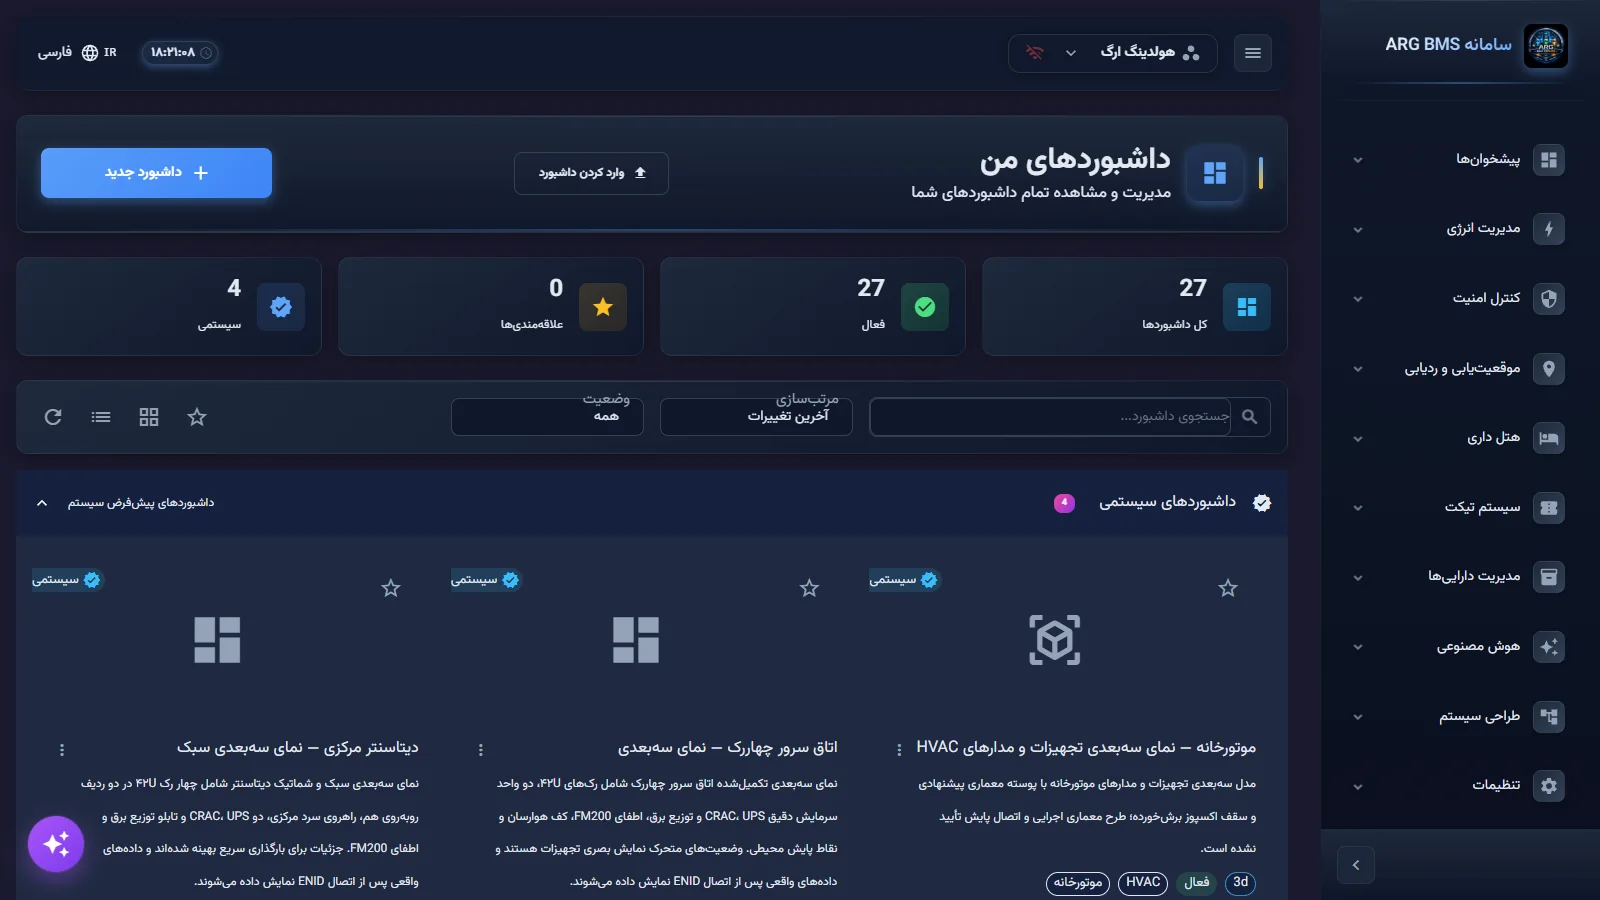
Work starts on the داشبوردهای من (My Dashboards) page; its path is «طراحی سیستم» ← «طراحی داشبورد» ← «داشبوردهای من» (System Design → Dashboard Design → My Dashboards). This page lists every dashboard in the project in collapsible groups: داشبوردهای سیستمی (System Dashboards), داشبوردهای دوبعدی (2D Dashboards), داشبوردهای سهبعدی (3D Dashboards), داشبوردهای لیستی (List Dashboards), داشبوردهای خودکار (Automatic Dashboards), داشبوردهای نقشه (Map Dashboards), داشبوردهای ترکیبی (Combined Dashboards), داشبوردهای موبایل (Mobile Dashboards), and الگوها (Templates).
| Section | Purpose |
|---|---|
| داشبورد جدید (New Dashboard) and وارد کردن داشبورد (Import Dashboard) | Create a new dashboard, or import a file exported from another installation |
| Stat cards | کل داشبوردها (Total Dashboards), فعال (Active), علاقهمندیها (Favorites), سیستمی (System) |
| جستجوی داشبورد... (Search dashboards...) | Search by title |
| مرتبسازی (Sort) | آخرین تغییرات (Last Modified), عنوان (الفبا) (Title (A-Z)), نوع داشبورد (Dashboard Type), بیشترین بازدید (Most Viewed), تاریخ ایجاد (Date Created) |
| وضعیت (Status) | همه (All), فعال, پیشنویس (Draft) |
| Each card's three-dot menu | ویرایش (Edit), کپی (Duplicate), اشتراکگذاری (Share), صدور (Export), حذف (Delete) |
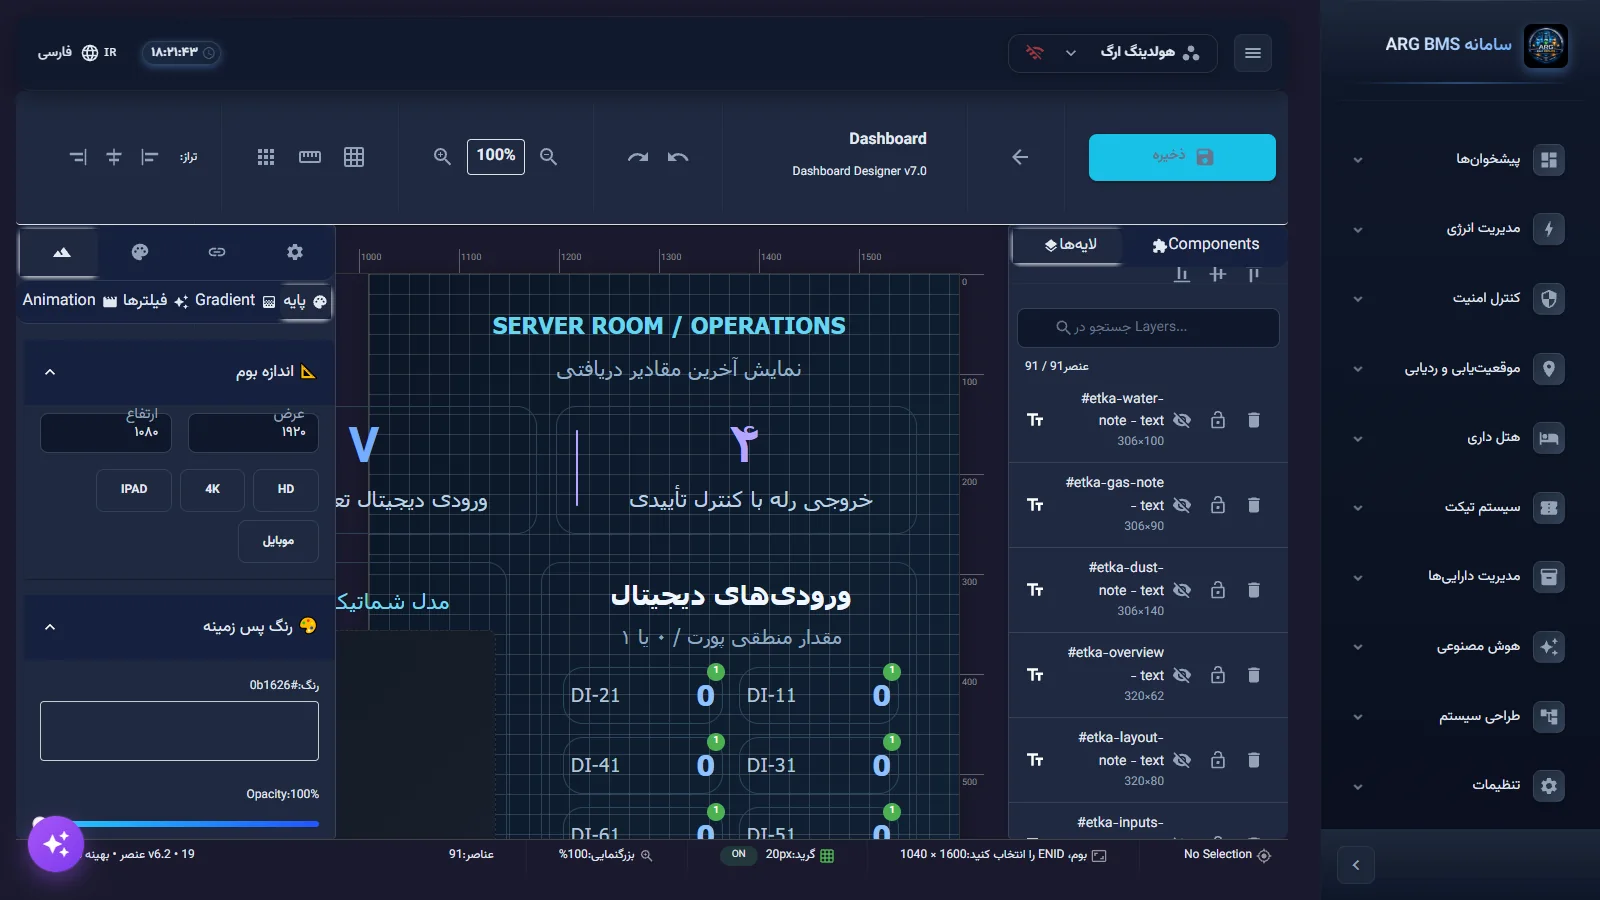
The 2D designer has three regions:
- Top bar: the ذخیره (Save) button, back to list, undo and redo, zoom, the تراز: (Align:) and توزیع: (Distribute:) tools, and the وارد کردن داشبورد and صادرات داشبورد (Export Dashboard) buttons. Below the title, the tool's name (Dashboard Designer) is shown.
- Right side panel: two tabs, لایهها (Layers) (a list of every element on the canvas, with show/hide, lock, and delete) and Components (the element palette). لایهها is open by default.
- Left properties panel: four icon tabs whose names show only on hover: ویژگیها (Properties) (gear icon), ENIDs (chain icon), Styles (color palette icon), and پس زمینه (Background) (landscape icon). Until an element is selected, the message هیچ عنصری انتخاب نشده (No element selected) is shown.
The palette has 24 elements in 10 groups. Group and element names are shown in English in the interface:
| Group | Elements | Purpose |
|---|---|---|
| Containers | Panel | A grouping frame with background and border |
| Basic Widgets | Text, Value Display, Button, Image | Title and label, a point value with unit, a command button or link, a logo or floor plan |
| Charts & Gauges | Chart, Gauge, Gauge Pro | Time-series chart and gauge |
| Advanced Controls | Switch Pro, Slider Pro, Knob, Thermostat | Command controls: switch, slider, knob, and thermostat |
| Media & Display | Web View, Camera, Animation | Web page, camera feed, simple animation |
| Navigation | Dashboard Link | Jump to another dashboard |
| Time & Date | Clock, Weather | Clock and weather |
| BMS Equipment | BMS Animation, Animation Pro | Animated equipment such as pumps, fans, valves, and chillers |
| 3D Objects | Object 3D, 3D Dashboard | A single 3D object, or an embedded 3D dashboard |
| Data Display | Advanced List, equipment status cards | An advanced table and graphical equipment monitoring cards |
Step by step
- Open the dashboards page. From the menu click «طراحی سیستم» ← «طراحی داشبورد» ← «داشبوردهای من», then click داشبورد جدید.
- Fill in the creation dialog. In the ایجاد داشبورد جدید (Create New Dashboard) window:
- عنوان داشبورد * (Dashboard Title *): for example "Server Room — Floor 2". Maximum 255 characters.
- نوع داشبورد * (Dashboard Type *): داشبورد 2D (2D Dashboard) (default). The other options are داشبورد 3D (3D Dashboard), داشبورد لیستی (List Dashboard), داشبورد نقشه (Map Dashboard), داشبورد خودکار (Automatic Dashboard), داشبورد ترکیبی (Combined Dashboard), and داشبورد موبایل (Mobile Dashboard).
- سطح دسترسی (Access Level): خصوصی (فقط من) (Private (only me)) (default), عمومی (همه) (Public (everyone)), or بر اساس نقش (Role-based).
- If needed, توضیحات (Description) (up to 500 characters), آیکون (Icon), and تگها (Enter برای افزودن) (Tags (press Enter to add)). Type each tag and press Enter.
Create New Dashboard · the "Dashboard Type *" list is open; "2D Dashboard" is the default - Open the designer. Find the new dashboard in the داشبوردهای دوبعدی group and click its card. Clicking a 2D dashboard card opens the designer directly.
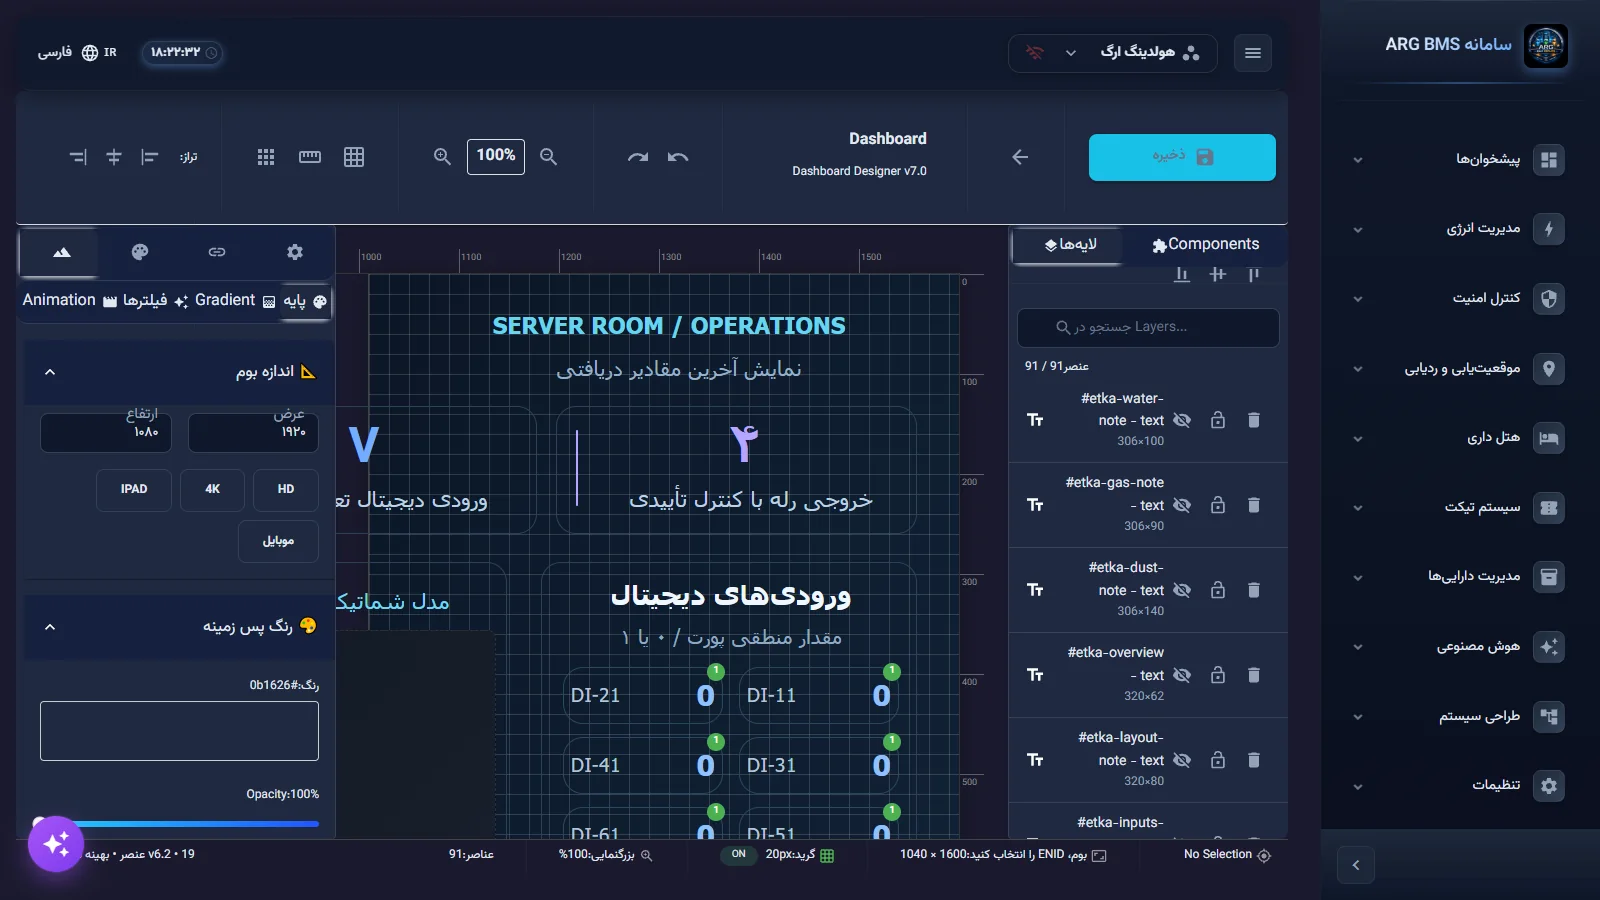
- Prepare the canvas. In the properties panel, open the پس زمینه tab (landscape icon). Under اندازه بوم (Canvas Size) set the canvas dimensions. To place a floor plan or map, click تصویر پس زمینه (Upload Image) under آپلود تصویر (Background Image). Allowed formats are JPG, PNG, and WebP, up to 5 MB. After upload, the message "Image uploaded successfully!" appears. The same tab also has background color and gradient, plus فیلترها (Filters) (brightness, contrast, saturation).
Background tab · the "Canvas Size" and "Background Image" sections, with the "Upload Image" button - Add an element. In the right panel open the Components tab and click an item — for example first a Panel, then a Text, then two Value Displays. The element appears on the canvas at its default size (for example Panel 300×300, Value Display 150×80, Button 120×40) and the message Element added appears. Elements are added by clicking, not by dragging from the palette.
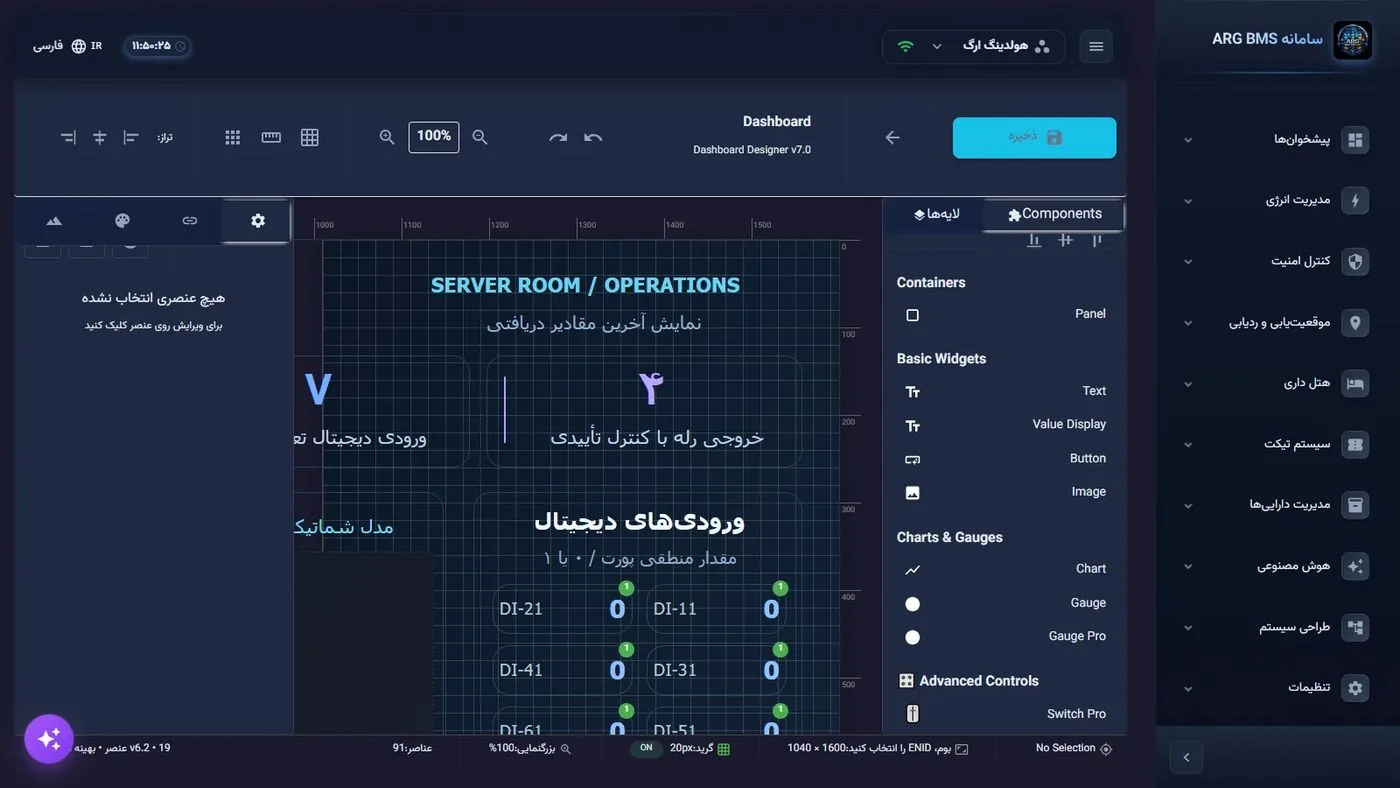
Palette, upper section · Containers through Advanced Controls 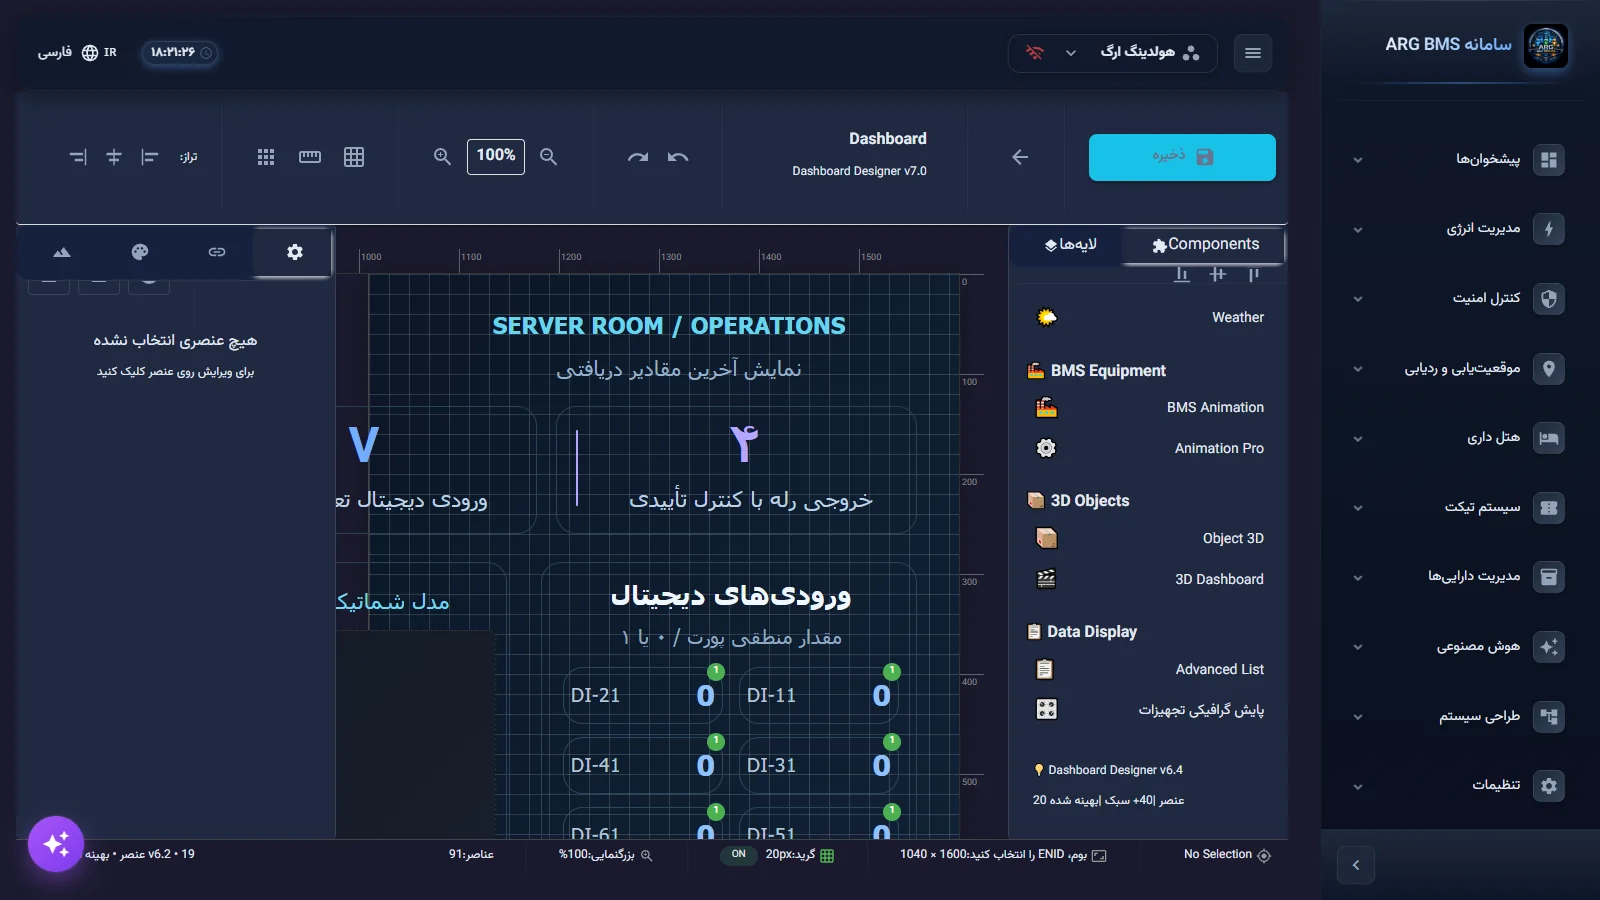
Palette, lower section · Media & Display through Data Display - Set position and size. Drag the element on the canvas, or in the ویژگیها tab, under موقعیت و اندازه (Position and Size), enter exact X, Y, عرض (Width), and ارتفاع (Height) values. Arrow keys also move the selected element; hold Shift for a finer step. The G key toggles the grid, R the ruler, and S snap-to-grid.
- Adjust the appearance. Every element shares these sections in the ویژگیها tab:
- تبدیل (Transform): چرخش: (Rotation:), قابل مشاهده (Visible), قفل شده (Locked)
- ظاهر (Appearance): رنگ پس زمینه (Background Color) and opacity
- گرادیان (Gradient), انیمیشن (Animation)
- حاشیه (Border): width, style (solid, dashed, etc.), color, and شعاع حاشیه: (Border radius:)
- فاصله (Spacing) and جلوه ها (Effects) (shadow)
- طرح بندی (Layout): Z-Index, i.e. stacking order — a higher number sits in front
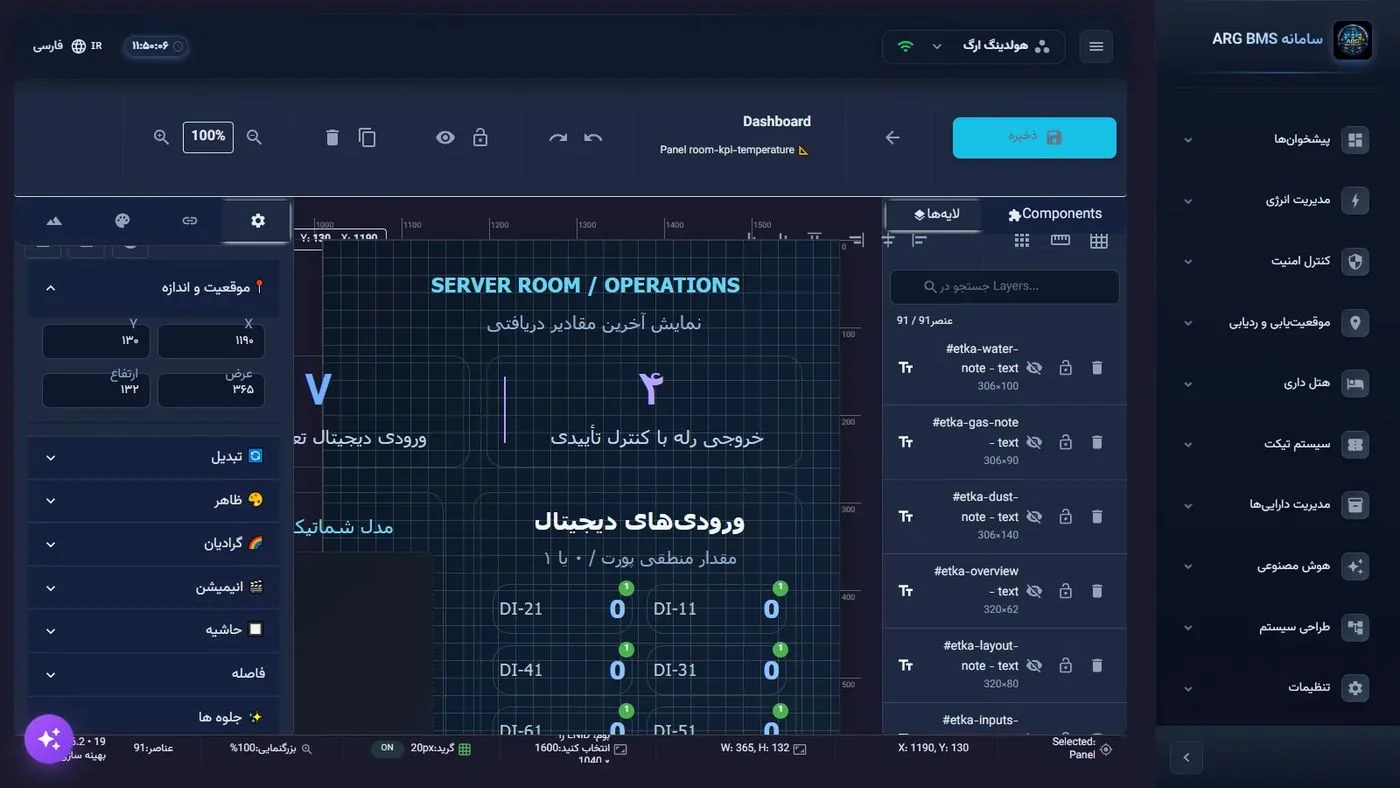
Selected element · the "Position and Size" section is open, with the remaining property sections listed below it; on the right, the "Layers" tab - Arrange several elements. Select multiple elements together (Ctrl+A selects all) and, from the top bar, use one of the تراز: tools (for example تراز کردن در بالا (Align top)) or توزیع: (توزیع افقی (فضا به طور مساوی) (Distribute horizontally (equal spacing))). Distribute needs at least two selected elements. Use آوردن به جلو (Bring to front) and ارسال به عقب (Send to back) to reorder elements; press Ctrl+D to duplicate an element.
- Save. Click ذخیره or press Ctrl+S. The message Saved (N elements) shows how many elements were saved. The designer also autosaves every 30 seconds. There is no separate publishing step: whatever is saved becomes available to users under the سطح دسترسی chosen at creation time.
- Leave the designer. Click بازگشت به لیست (Back to list) (the arrow beside the title). If there are unsaved changes, the prompt "Unsaved changes. Leave the designer without saving?" appears.
- Manage the dashboard. In داشبوردهای من, from the card's three-dot menu:
- کپی: creates a fresh copy (message "Dashboard '…' duplicated").
- صدور: outputs the dashboard file.
- حذف: deletes it after confirming "Are you sure you want to delete dashboard '…'? This action cannot be undone."
Export Dashboard · the "ZIP (complete)" option with images, and the settings-only JSON option
Tips and common mistakes
- Clicking a 2D dashboard card opens the designer, not the end-user view. See the live view under «پیشخوانها» ← «دیدکلی» (Consoles → Overview).
- Choose the dashboard type correctly at creation time. The type list on the dashboard edit page is not the same as the list in the creation dialog.
- Messages inside the designer are in English, such as Saved, Deleted, Duplicated, and Aligned. This is expected behavior.
- The in-designer help text talks about "dragging" an element from the palette, but adding an element is done only by clicking.
- The الگوهای داشبورد (Dashboard Templates) and مدیریت رسانه (Media Management) pages are demonstrational in the current version. Building a dashboard from a template is not active in this version; load the floor plan image from the پس زمینه tab inside the designer itself.
- Do not import a file exported from a 3D dashboard into the 2D designer; the system rejects it.
- If the title is left blank, the message "Dashboard title is required" appears and the dashboard is not created.
Summary
- A 2D dashboard is created from "My Dashboards" → "New Dashboard" with type "2D Dashboard".
- The palette has 24 elements in 10 groups; elements are added by clicking an item.
- An element's position and appearance are set in the "Properties" tab, and the canvas and floor plan in the "Background" tab.
- "Save" (or the 30-second autosave) is the publish step; "Access Level" determines who can view it.
- To move a dashboard to another installation, use "Export Dashboard" → "ZIP (complete)", and "Import Dashboard" on the destination.
Hands-on exercise on the live demo
Work on the public demo (bms.argsrv.com, project "ARG Holding"). Do not change or delete existing demo data or dashboards.
- In داشبوردهای من, create a dashboard titled "Exercise — your name", with نوع داشبورد * = داشبورد 2D and سطح دسترسی = خصوصی (فقط من).
- In the designer, from Components add a Panel, a Text with the text "Server Room", and two Value Displays, and arrange them inside the Panel.
- Select the two Value Displays together and align them with تراز کردن در بالا.
- Click ذخیره and confirm the Saved message.
- Finally, delete the exercise dashboard from the card's menu using حذف.
If the demo account does not allow saving, go only as far as the preview stage: fill in the creation dialog, then open one of the existing 2D dashboards and just review the palette, the properties panel tabs, and the صادرات داشبورد menu, without saving anything.
Lesson check
Answer at least 3 of 4 correctly to pass.
- 1. What must you do to add a Value Display element to the canvas?
- 2. Which element belongs to the Advanced Controls group?
- 3. How often does the 2D designer autosave?
- 4. To move a dashboard, together with its images, to another installation, which option is correct?