Architecture & data path
Follow an observation from device to operator and a command back to the field, with shared point identity, equipment models and deployment topologies for industry and infrastructure, from one site to many.
How does an observation become a decision and action?
An engineering example using pump-pressure monitoring. Select each stage to see its input, processing and output. Actual paths depend on project equipment and configuration.
- Input
- A pressure-sensor message or device register
- Processing
- The adapter knows the address, data type and protocol format. The raw value is converted using the configured engineering unit and scale.
- Output
- Pressure value, communication state and observation time
Engineering valueProtocol differences stay in the connection layer, while application logic consumes pressure.
Architecture and Data Path
The system consists of a Java core (backend), a responsive web interface (frontend), and several companion services, all sitting behind a single secure gateway. Every value passes through a defined chain with known timings, from the moment it is read from the device to the moment it reaches a dashboard element; this end-to-end chain has been tested against real devices.
Data Path from Device to Dashboard


Ingestion
Three queues and four processing threads: an input queue with a capacity of 10,000 messages, and an output queue and an SMS queue of 1,000 each. Unknown points are created automatically. A value change is forwarded to subsequent layers only if it differs from the previous value.
Persistence
Current values are written to the main database in batches every 5 seconds; history is stored in a separate database per project, with monthly partitioning and batch inserts every 60 seconds. Each point’s polling history is retained for 90 days.
Publication
Project-scoped WebSocket: events reach browsers every 75 milliseconds in batches of up to 500; device online/offline status and command receipts are also published over the same channel. Event subscriptions and publication are controlled within project scope.
Command (Return Path)
Dashboard commands pass control authorization and the required confirmation. A unique key supports duplicate-request control and intent tracking; the adapter then translates the command into a protocol operation (SET, register, node or topic). Receipts identify the reported stage, while device feedback is used to assess the physical result.
Point Identifier (ENID) and the Value Chain
Every point’s identity across the system is a 16-digit ID that encodes the device serial, base type (protocol/device), signal category, direction, data type, and port number. This ID is carried unchanged through messages, control variables, WebSocket sessions, logic rules, and the API.
Structure and Point Model
Everything in the system has a defined place in the hierarchy, and every data point receives a unique 16-digit ID (Chapter 2); this same ID is used in the dashboard, logic, assistant, and API.
Hierarchy
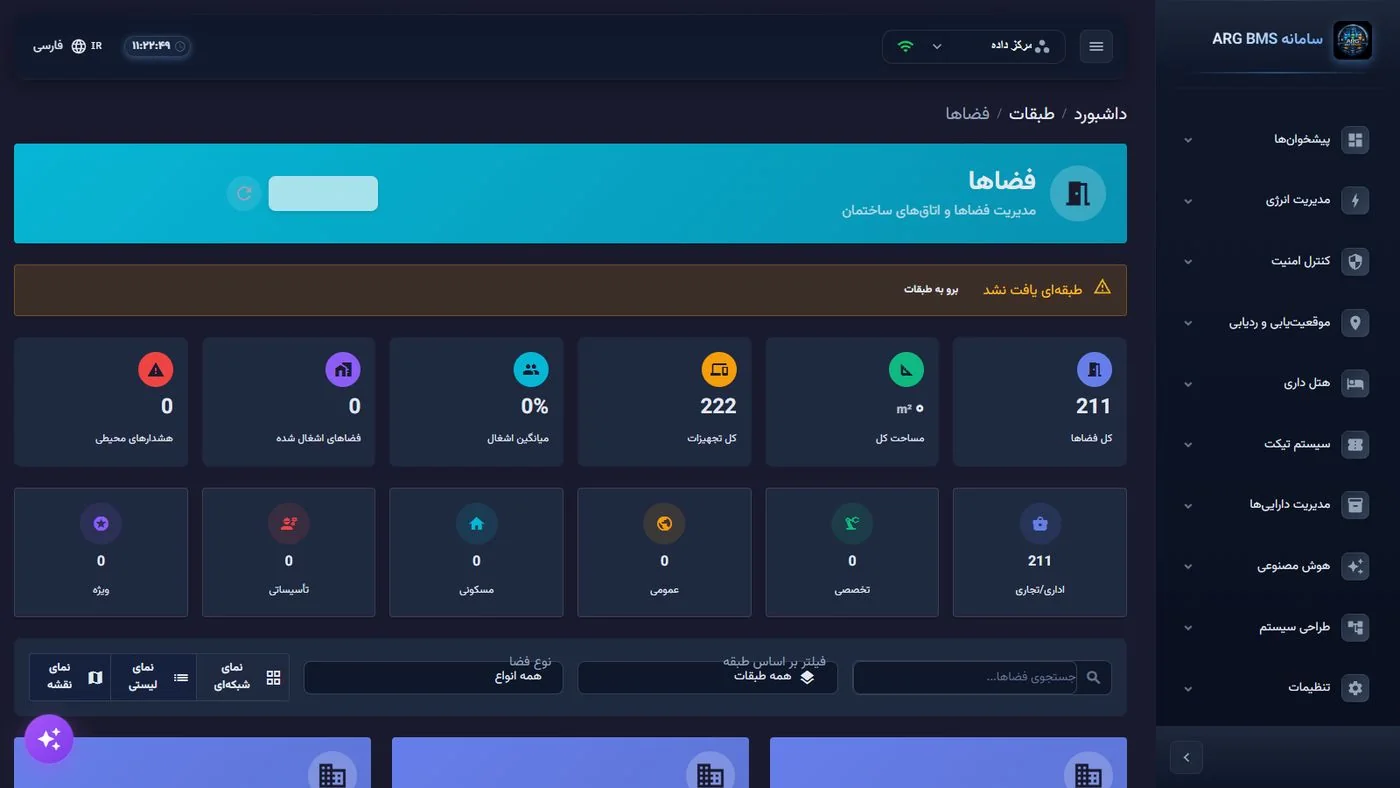
Project → organization → building → floor → space → device → point. Duplicating a floor with all its spaces and devices in a single action; device grouping; searching devices and points by name, category, space, and floor.
Points (Control Variables)
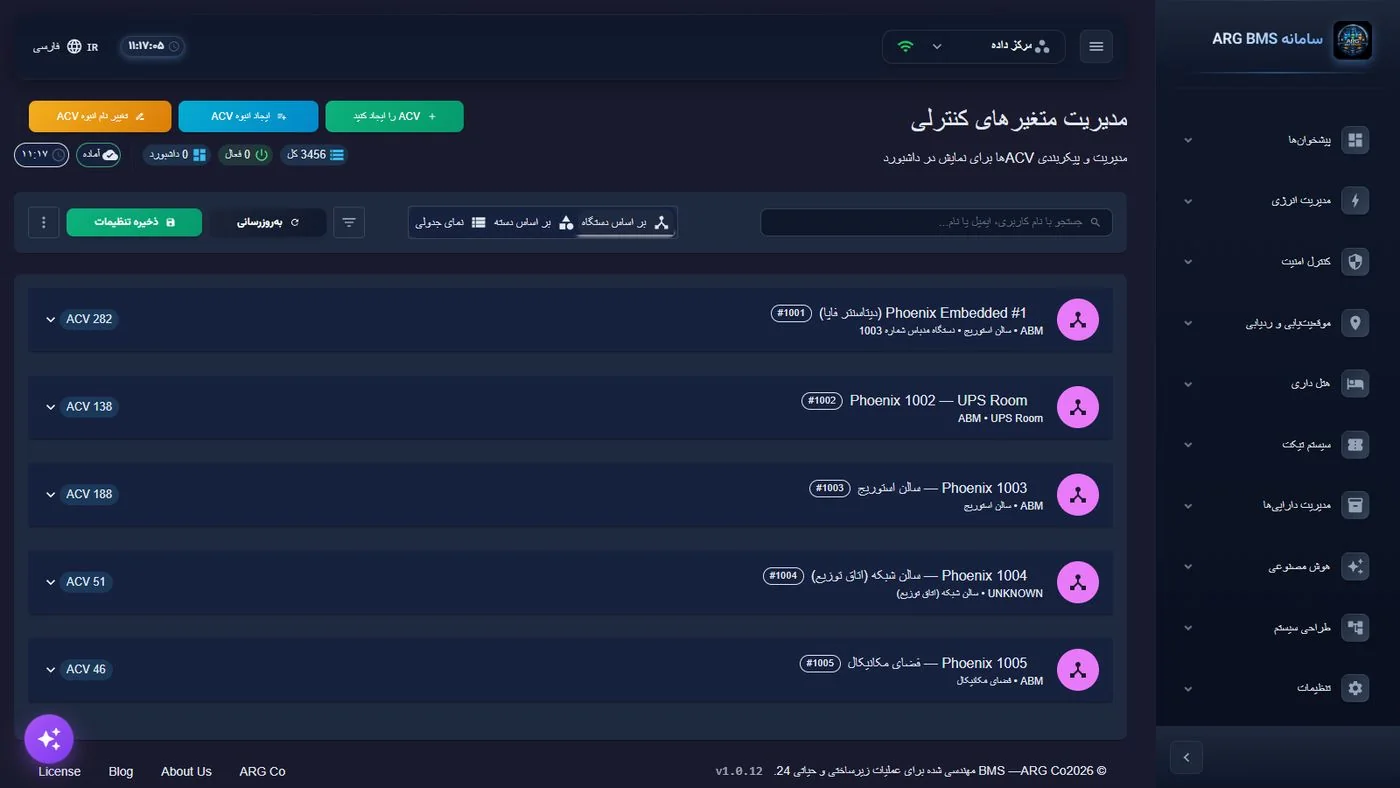
Digital and analog inputs/outputs, counters, timers, computed variables; 55 types and around 500 named signal categories. Each point has: a unit, scale (factor/offset), four-level limits, notification bandwidth and delay, flags for network publication and history storage, and a computed expression on the value.
Building from the Catalog
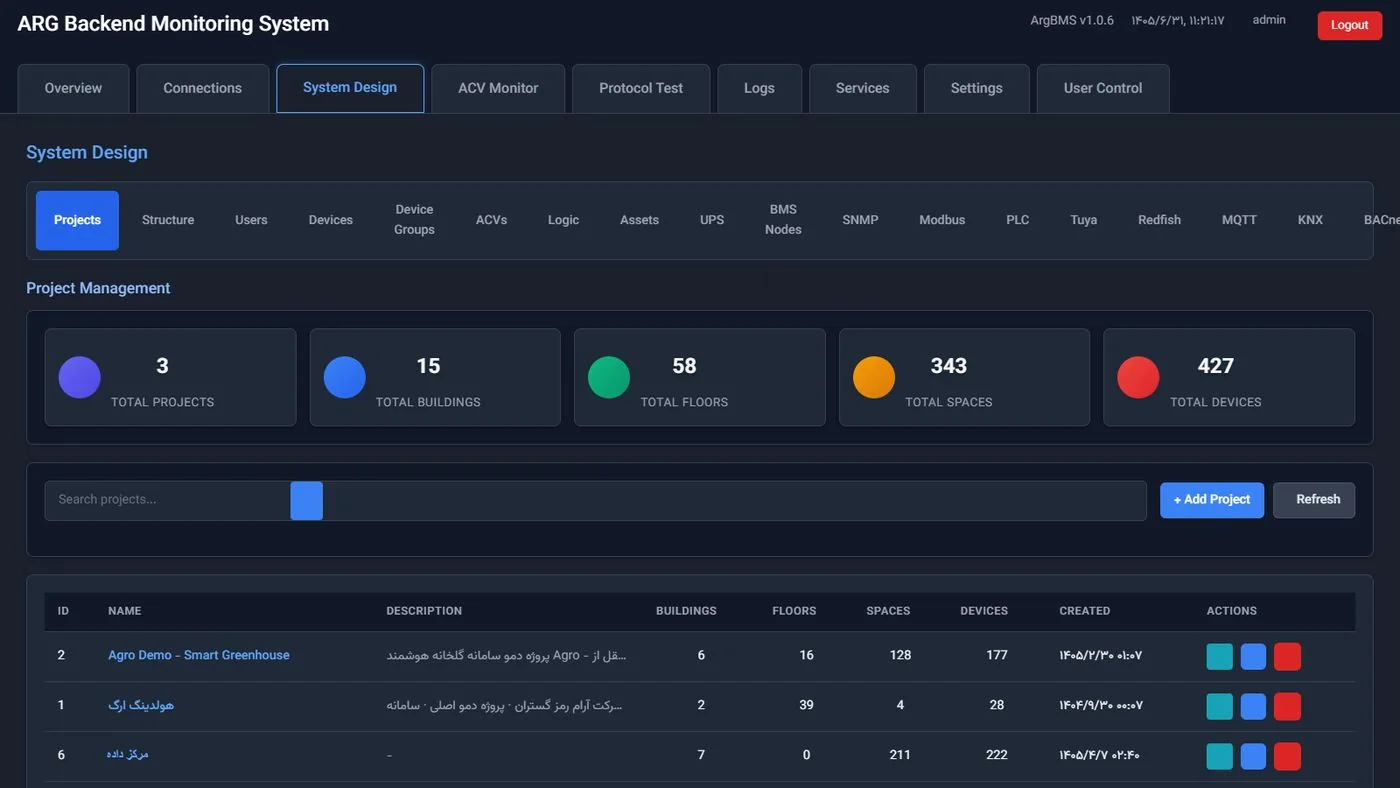
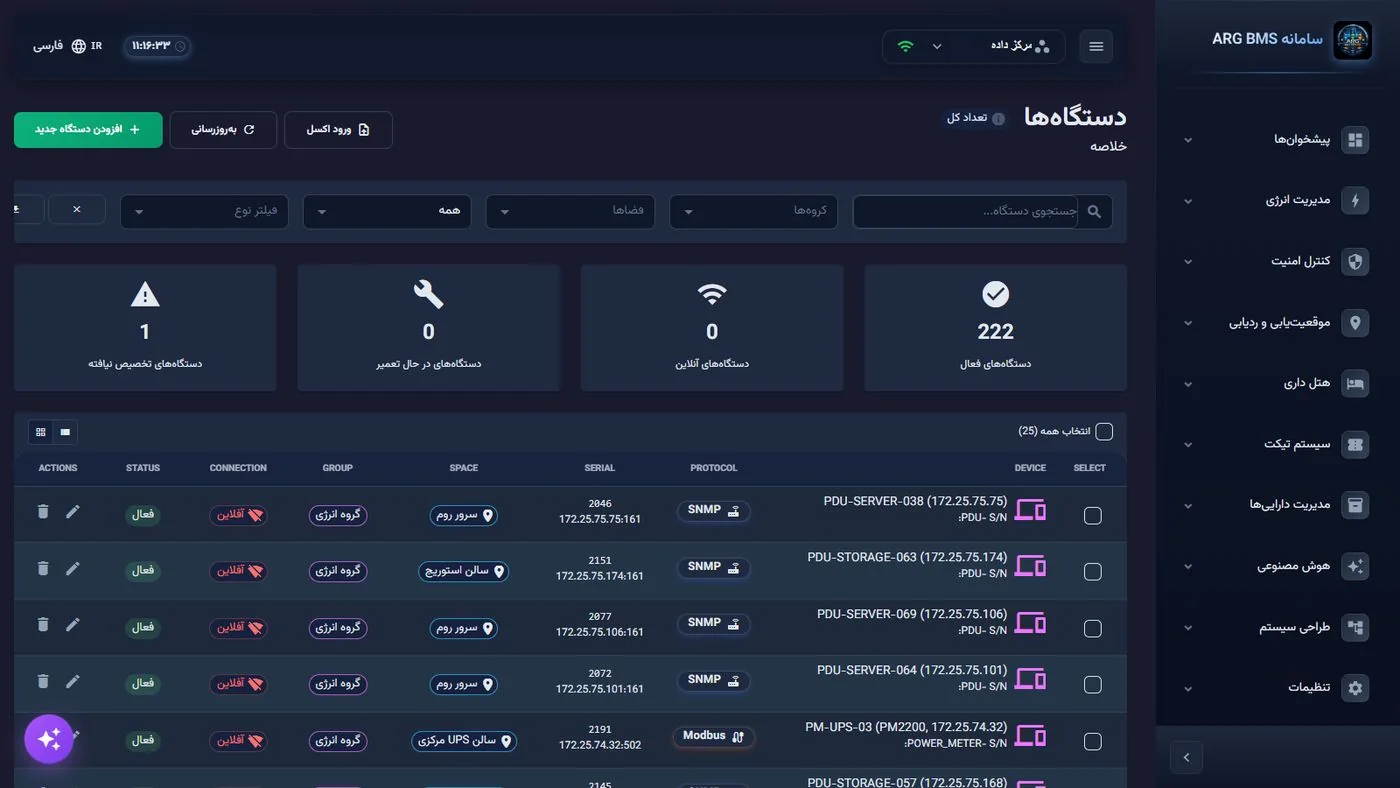
By selecting a model from the Device Catalog (Chapter 7), the device and all its points are created automatically with the correct protocol mapping, with no repetition; the catalog profile version is recorded on the device.
Bulk Import
Setup from an Excel file for large projects: buildings, spaces, and devices are imported all at once; multiple devices can be created simultaneously from a single model.
Deployment and Network Topologies
Three common deployment patterns separate equipment networks from user access. The proposed design routes public access through a secure web gateway and blocks direct internet access to equipment; project design specifies network rules and administrative access.
1 · On-Premise
The server sits on the customer’s management VLAN, with direct access to the device VLAN (SNMP/Modbus/OPC UA); users connect from the internal network or VPN; an offline map and a local language model serve closed networks. Suited to data centers, sensitive sites, and industrial facilities.
2 · Cloud with Device Link
The system runs on ARG infrastructure or the customer’s cloud; ARG field controllers connect to the server via a WebSocket link from behind NAT (no static IP, no inbound port opening); SNMP/Modbus devices connect through the local controller. Suited to distributed sites, stations, and small buildings.
3 · Hybrid
The system’s core stays on-premise for live monitoring and control; a cloud instance provides manager access, reporting, and ARG AI; synchronization happens via API/Webhook. Suited to holding companies with multiple sites.
Gateways and Traffic
- Inbound: only HTTPS/WSS (443) through the TLS gateway; administrative SSH
- Outbound to devices: SNMP 161/162, Modbus 502, OPC UA, MQTT 1883/8883, PLC (102, 44818, 9600, 5000+), Redfish 443, Tuya 6668
- Companion services stay on the internal network only; no service is directly exposed to the internet
- Outbound notifications: carrier SMPP, SMTP, Telegram (where permitted), Webhook
Recommended Hardware
The following examples support initial planning. Final sizing depends on point-change rates, concurrent users, drivers, history depth and project-specific load testing.
| Project Size | Devices / Points | Server | Storage |
|---|---|---|---|
| Small | Up to 100 devices / 1,000 points | 2 cores, 4 GB, PostgreSQL | 40 GB |
| Medium | Up to 500 devices / 5,000 points | 4 cores, 8 GB, PostgreSQL | 100 GB (1-year history) |
| Large | Up to 2,000 devices / 20,000 points | 8 cores, 16 GB; separate database | 500 GB SSD |
| Multi-site | Multiple projects | Main server + separate companion services; ARG AI with optional GPU | Based on total |
See the Digital Twin live
The live ArgBMS demo with real 3D twins, dashboards and logic.