Reference & roadmap
Integration with other systems, the reference for events, settings and the data model, step-by-step guides to daily work, FAQ and the roadmap.
Integration Guide and API Reference
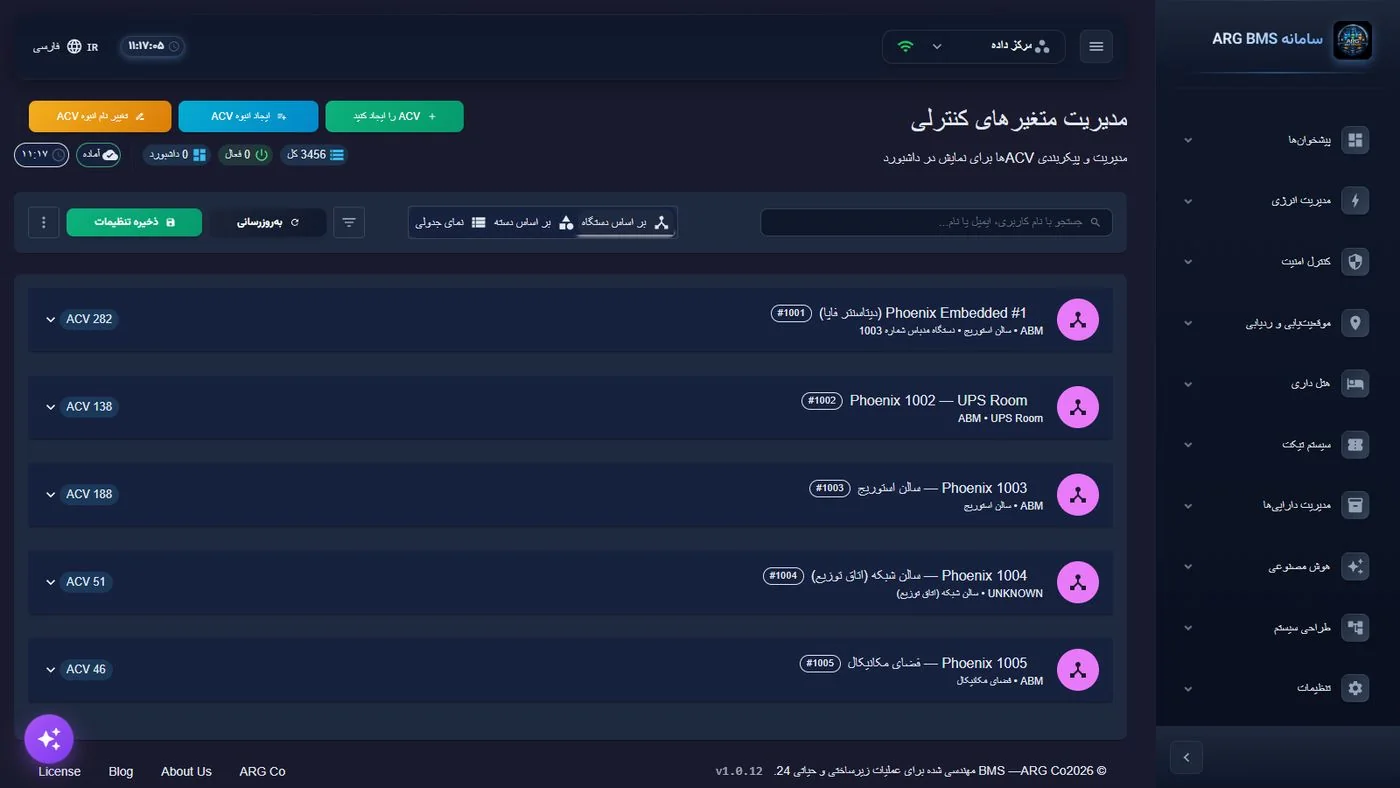
All four services expose a REST API with OpenAPI (Swagger) documentation. The Digital Twin system has the broadest surface, with 1,066 operations across two namespaces — public (/api, with a project key) and administrative (/internal/api, with an admin session); WebSocket for live data and commands, Webhook for outbound events.
Digital Twin System API Families (Selected)
| Family | Operations | Purpose |
|---|---|---|
| SNMP management | 64 | Devices, OID mapping, templates, MIB, forced polling, traps |
| Logic management | 47 + 19 | Rules, limits, scripts, state machines, scenarios, test runs, expression validation |
| Redfish management | 46 + 9 | Servers/BMC, resource mapping, templates, tree browsing, writes |
| Modbus management | 42 + 21 | Devices, registers, templates, scanning, coil and register read/write |
| Equipment catalog (in-system) | 31 + 29 + 14 | Models, brands, categories, device creation from a model, sync with the catalog service |
| PLC | 30 + 10 | PLC devices, tags, protocols, read/write |
| Equipment and groups | 30 + 12 + 14 | Device CRUD, serials, grouping, conversion to a protocol device |
| Assets and maintenance | 30 + 10 | Assets, cost, maintenance, relationships, transfer, reporting |
| Points (ACV) | 27 + 8 + 9 | Point CRUD, real-time values, alarmed points, ID parsing, reload |
| Notification | 27 + 10 | Channels, groups, recipients, templates, logs, channel testing, escalation policy |
| Battery and UPS | 28 + 19 + 13 + 9 + 11 | UPS status, battery nodes, history, control commands (node reboot…) |
| Tuya · MQTT · OPC UA · KNX · BACnet · M‑Bus | 24 · 28 · 32 · 19 · 34 · 15 | Devices, mappings, discovery, read/write for each protocol |
| Project structure | 20 + 9 + 9 + 11 + 10 + 14 | Project, organization, building, floor, space; floor cloning |
| Media | 20 + 12 | File upload/serving, dashboard images, 3D models |
| People, users, roles, permissions, keys | 20 + 19 + 9 + 16 + 9 | Identity, roles, permission assignment, project keys |
| Ticketing | 18 | Tickets, comments, status, SLA |
| Protocol mapping and registry | 18 + 13 | Bidirectional ID ↔ OID/register mapping, writes by ID |
| Smart assistant | 17 | Chat, conversations, memories, knowledge, action confirm/cancel |
| Dashboards | 14 | Dashboard CRUD, elements, cloning, export |
| Energy | 11 + 9 + … | Meters, tariffs, cost, demand, real-time |
| Settings, logging, monitoring, queues, system | 15 + 18 + 10 + 8 + 8 | 335 settings, per-category log level, GC, restart, queue stats |
| Simulator, SMPP, internal services | 15 + 14 + 12 | Simulator control, SMPP connection, service start/stop |
Companion Services
| Service | Operations | Families |
|---|---|---|
| Equipment catalog | 69 | Models (11), categories (11), brands (8), tags (8), protocol specs (6), ports (6), accessories (6), documents (6), images (4), discovery (5), enrichment agent (5), reference (5), sync (2), import/export (2), search, stats |
| ARG AI | 145 | ML analysis (68), chat (8), alerts (8), multi-site (7), providers (7), auto-remediation (7), prompts (6), data ingestion (6), ML reports (5), compliance (5), settings and health (5), reporting (4), twin (4), dashboard (4), mobile (4), Webhook (4), analytics (4), auth (3), export (2), CSV (1) |
| Offline map | 18 | Regions (11), downloads (7), z/x/y tile service (2) |
| Twin Designer | 14 | Types, drafts, validation, compatibility, publishing, lifecycle, Modbus templates, code generation |
Integration Patterns
Reading Live Data
WebSocket connection with a project key → authenticate → enid_subscribe for the desired points → receive batch packets every 75 ms. For systems without WebSocket: poll the REST endpoint for real-time values periodically.
Sending a Command
set_enid_value over WebSocket, or a REST command call with a key that has control permission and a unique command key; the execution receipt comes back as COMMAND_RECEIPT_UPDATE.
Receiving Events
Webhooks from rules and notifications (JSON with point ID, value, severity, timestamp); or query the REST events and notification-log endpoints.
Onboarding Structure and Equipment
Structure API (project → … → space) and equipment, or a bulk-import Excel file; generate points from the catalog with a single call; sync the central catalog with full-snapshot and changes.
References: Events, Settings, Functions, Elements
Event Types and Severity
| Event | When It Is Logged |
|---|---|
| RULE_FIRED · STATE_CHANGED · SCRIPT_EXECUTED | Rule execution, state-machine transition, script completion (with result) |
| ACV_ALARM · ACV_LIMIT_EXCEEDED · ACV_VALUE_CHANGED | A point entering alarm state, crossing a limit, value change (optional, for important points) |
| DEVICE_CONNECTED · DEVICE_DISCONNECTED | Change in a device's online status on any channel |
| SERVICE_STARTED · SERVICE_STOPPED | Start/stop of protocol and notification services |
| USER_LOGIN · USER_LOGOUT · SETTINGS_CHANGED · MANUAL_COMMAND · CUSTOM | Login/logout, settings change, manual operator command, custom event from a script |
| Severity | INFO · WARNING · CRITICAL · ERROR — filterable in the event log and usable in escalation policy |
Server Settings Categories (335 Settings)
Each setting has a data type and validation, is stored in a file and mirrored in the settings table; scheduling intervals (batching, history, energy) are read from here. Export/import lets configuration move between environments.
Expression Language Functions
| Function | Meaning |
|---|---|
ACV['enid'] | Current value of the point |
HOUR() MINUTE() SECOND() | Current server time |
DAY_OF_WEEK() DAY_OF_MONTH() MONTH() YEAR() | Date components |
TIME_IN_RANGE(h1,m1,h2,m2) | True if the current time is within the range (overnight ranges are also supported) |
IS_WEEKDAY() IS_WEEKEND() | Workday / weekend |
TIMESTAMP() | Unix time |
AVG(enid,n) MIN(enid,n) MAX(enid,n) | Statistics over the point's last n values |
LAST_N(enid,n) | The last n values |
CHANGED(enid) RISING(enid) FALLING(enid) | Change / upward trend / downward trend in the recent buffer |
HISTORY_SIZE(enid) | Number of values in the buffer |
Common Properties of 2D Elements
Position and size, rotation, layer (z), lock, hide, background/border/text color, font and size, corner radius, shadow, opacity, display condition, link to another dashboard, point binding (single or multiple points with aggregation), value mapping (discrete/range), unit and decimal precision, command (type, value, confirmation).
BMS Animation Categories (153)
Permission Domains (12 × 7 Actions)
Domains: dashboard, structure, equipment, points, logic, alerts, energy, assets, users, settings, media, reports. Actions: view, create, edit, delete, control, export, administer. Default roles: system administrator, project manager, operator, technician, energy manager, security, visitor.
FAQ and Glossary
Frequently Asked Questions
Does the system work without internet access?
Yes. All components run inside the customer's network; the map is served from the offline map server, and the assistant's language model can be local. Only Telegram notifications and some language-model providers need internet access.
What if a device is not in the catalog?
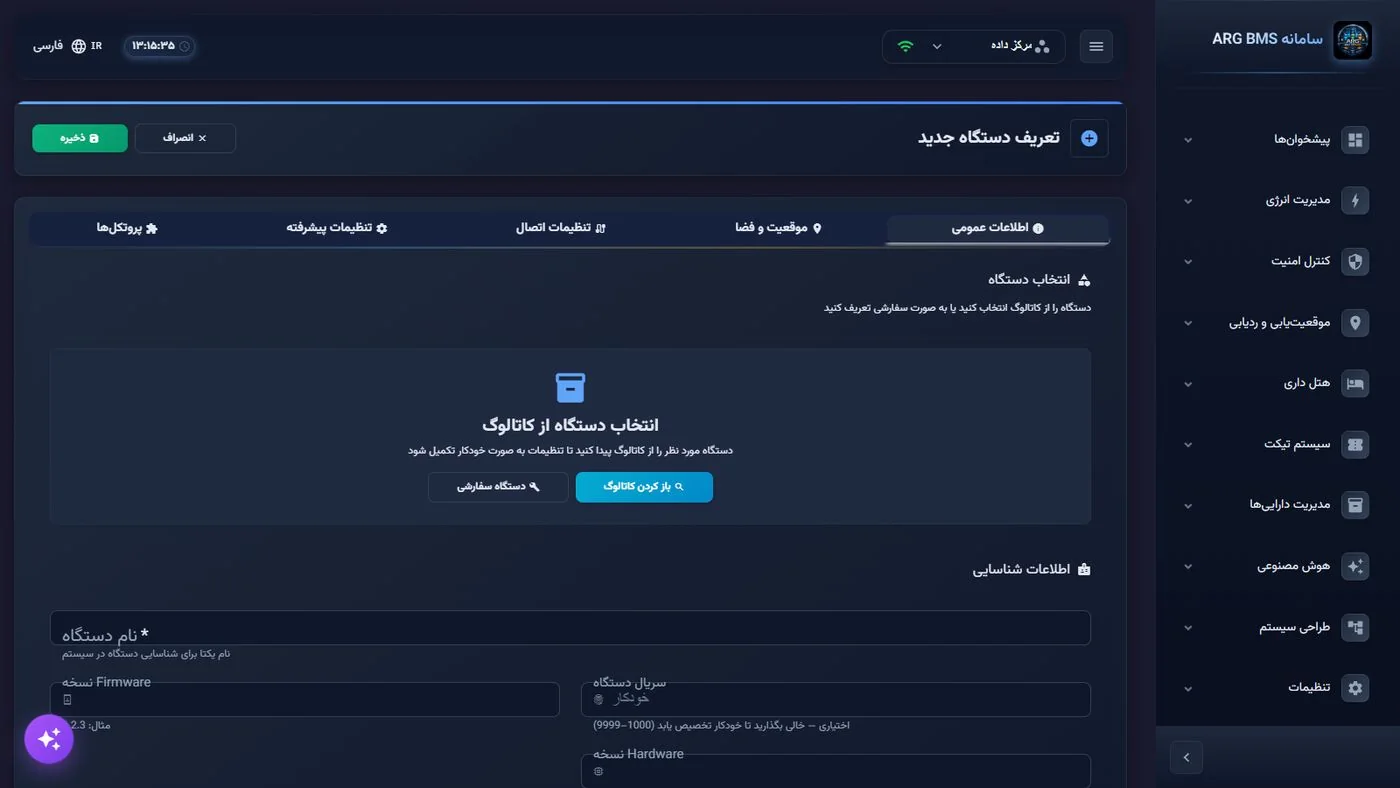
It can be created directly in that project through the "Request to add equipment" interface, or with manual OID/register/tag mapping; it can then be added to the catalog so it is ready for future projects.
How many points does it support?
This document's reference sample is 427 pieces of equipment and 3,964 points across three projects. The distribution engine delivered 69,000 updates per second on an ordinary server without loss (Chapter 31); each project has its own independent history store, and very large sites are split into independent units.
What happens with a mistaken or duplicate command?
A command requires control permission and password confirmation, executes only once per unique key, and the equipment's receipt is logged. Smart-assistant actions are never executed without confirmation.
Where is the data stored?
In PostgreSQL on the customer's server (or a dedicated cloud instance); daily backups; no data is sent to any external service except the language-model provider the customer chooses.
Can the customer's existing system be kept?
Yes. It connects to the existing system via OPC UA, Modbus, MQTT or WebSocket and can sit on top of it as a visualization/analytics layer; frames from ARG's previous-generation SCADA are also accepted.
Glossary
| Term | Meaning in This System |
|---|---|
| Digital twin | The digital counterpart of a piece of equipment or a site that carries its live values, status, history, limits and behavior |
| Point (ACV) | An active control variable; an input or output signal with a unit, scale and limits |
| ENID | A unique 16-digit identifier for each point across the entire system |
| Twin type | A data-driven definition of an equipment type (points, events, commands, protocol mapping) from which executable code is generated |
| Limit with hysteresis | A threshold that requires crossing the threshold ± a safety margin to clear, so it doesn't generate flapping alerts |
| Scenario | A set of actions that can be activated/deactivated, with a trigger and a shutoff condition |
| State machine | A behavioral model with states and transitions whose current state persists |
| Product profile | A cut of the menus and modules for a customer type (BMS, DCIM, IoT…) |
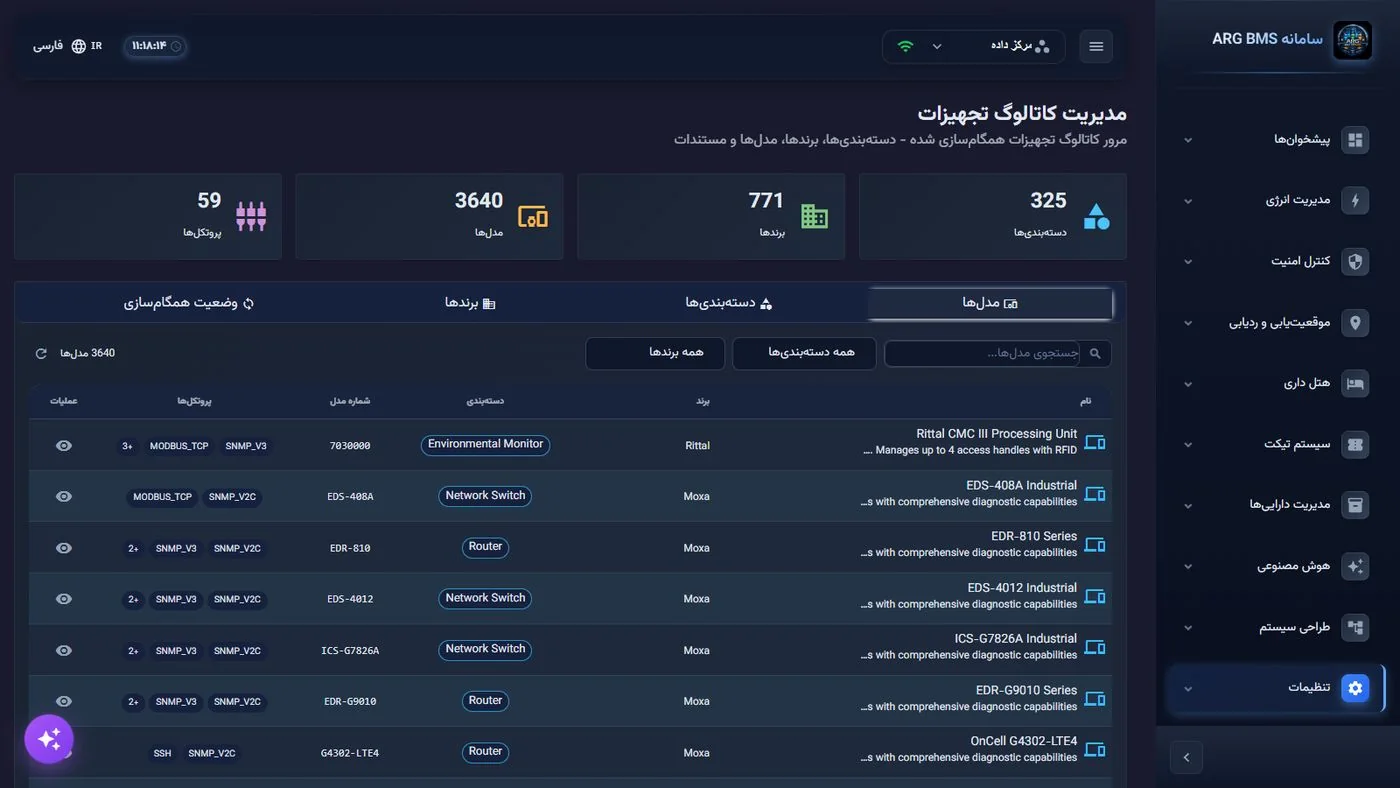
| Equipment catalog | A central knowledge base of equipment models with ready-made points and protocol specs |
| MBTiles | The standard map-tile package format for offline use |
| DCIM · PUE | Data center infrastructure management · ratio of total power to IT power |
Step-by-Step Guide — Everyday Tasks in the System
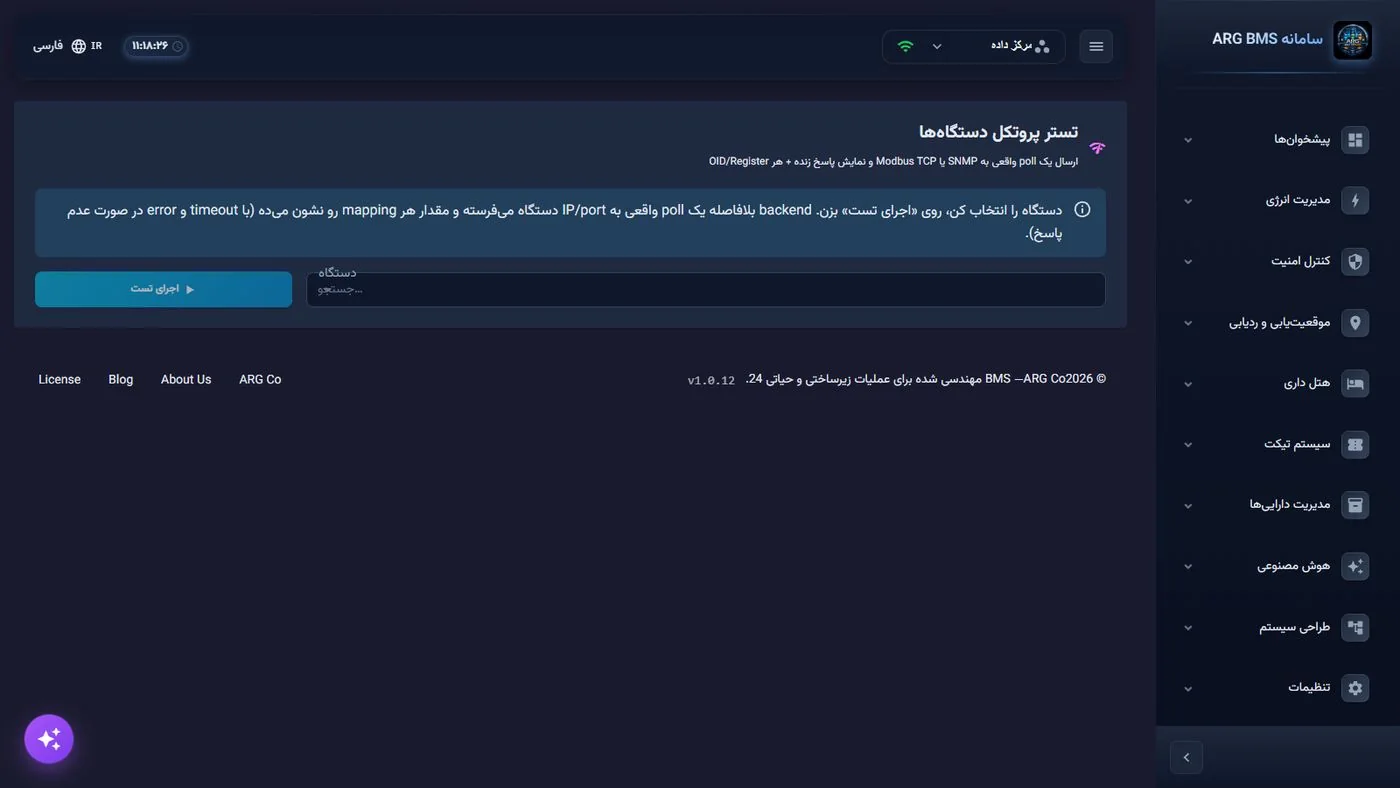
Seven common routines, exactly as a user performs them in the system interface. Each routine is illustrated with real screens.
A · Adding a New Device from the Catalog
B · Defining a Computed or Manual Point
C · Building a 2D Dashboard
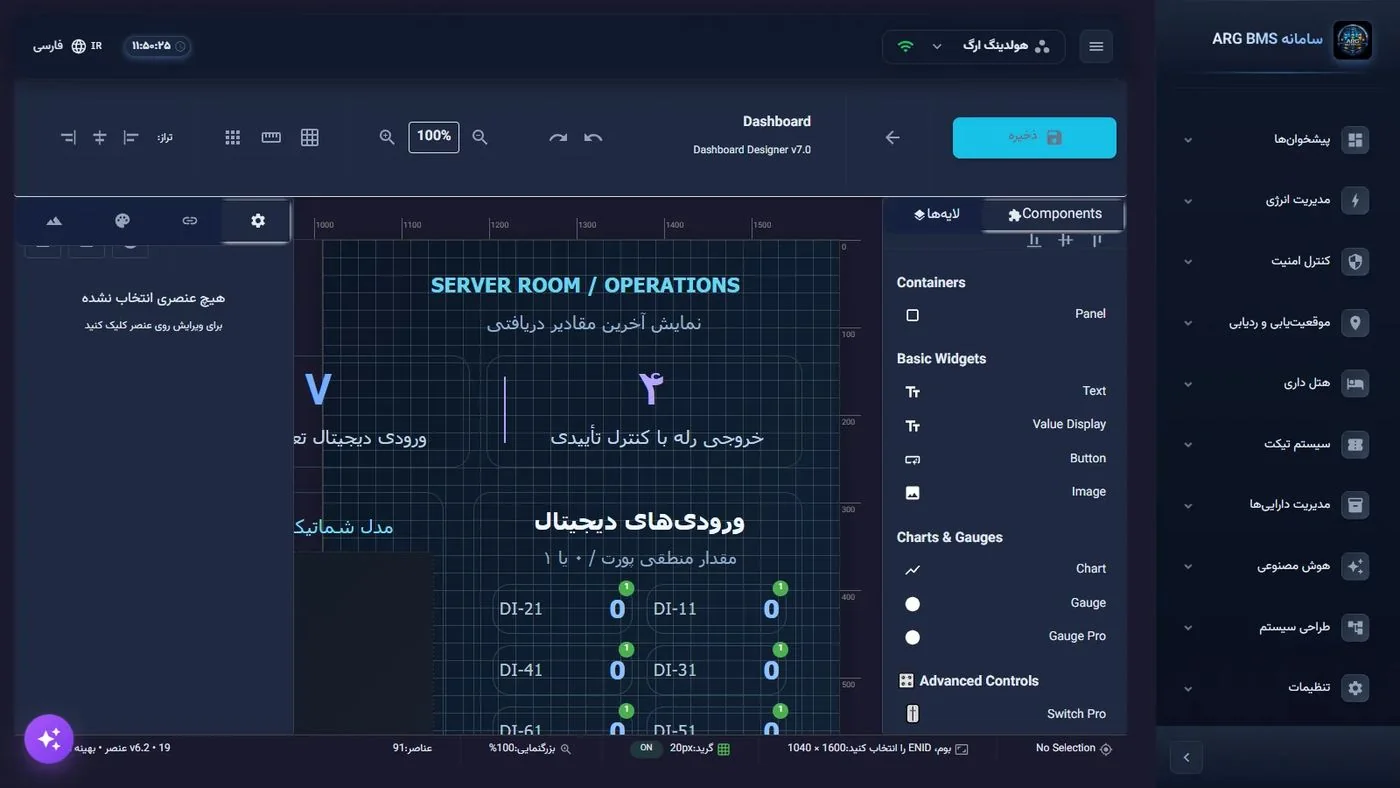
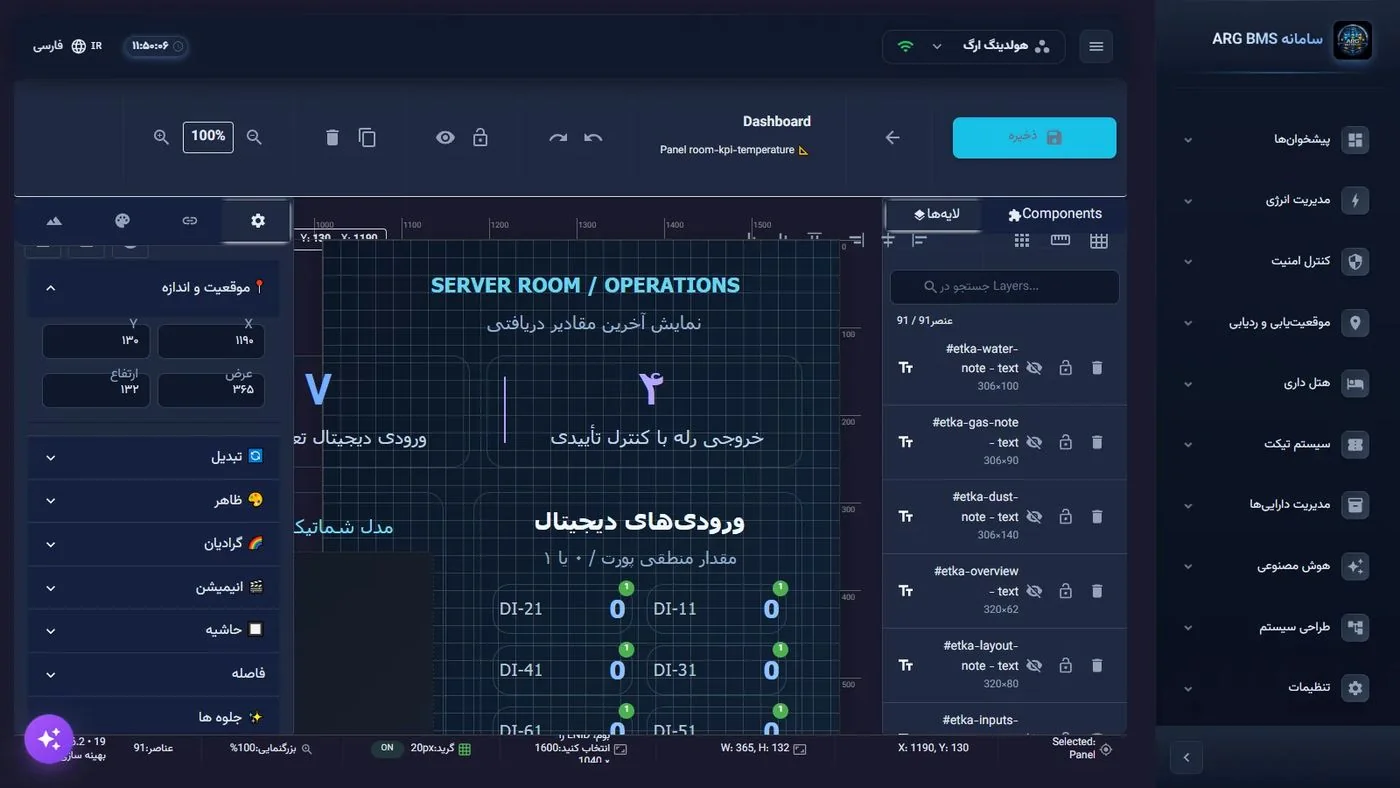
D · Building a 3D Scene
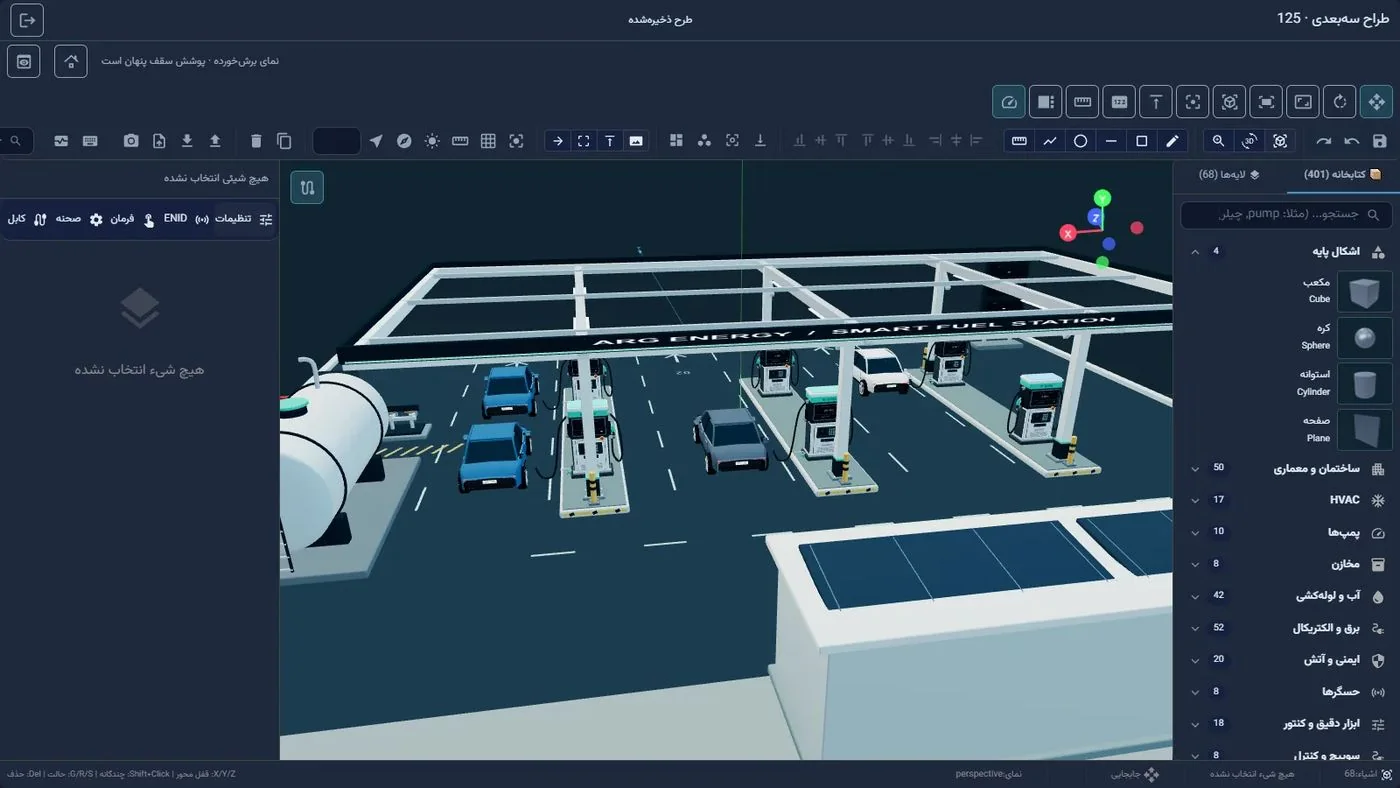
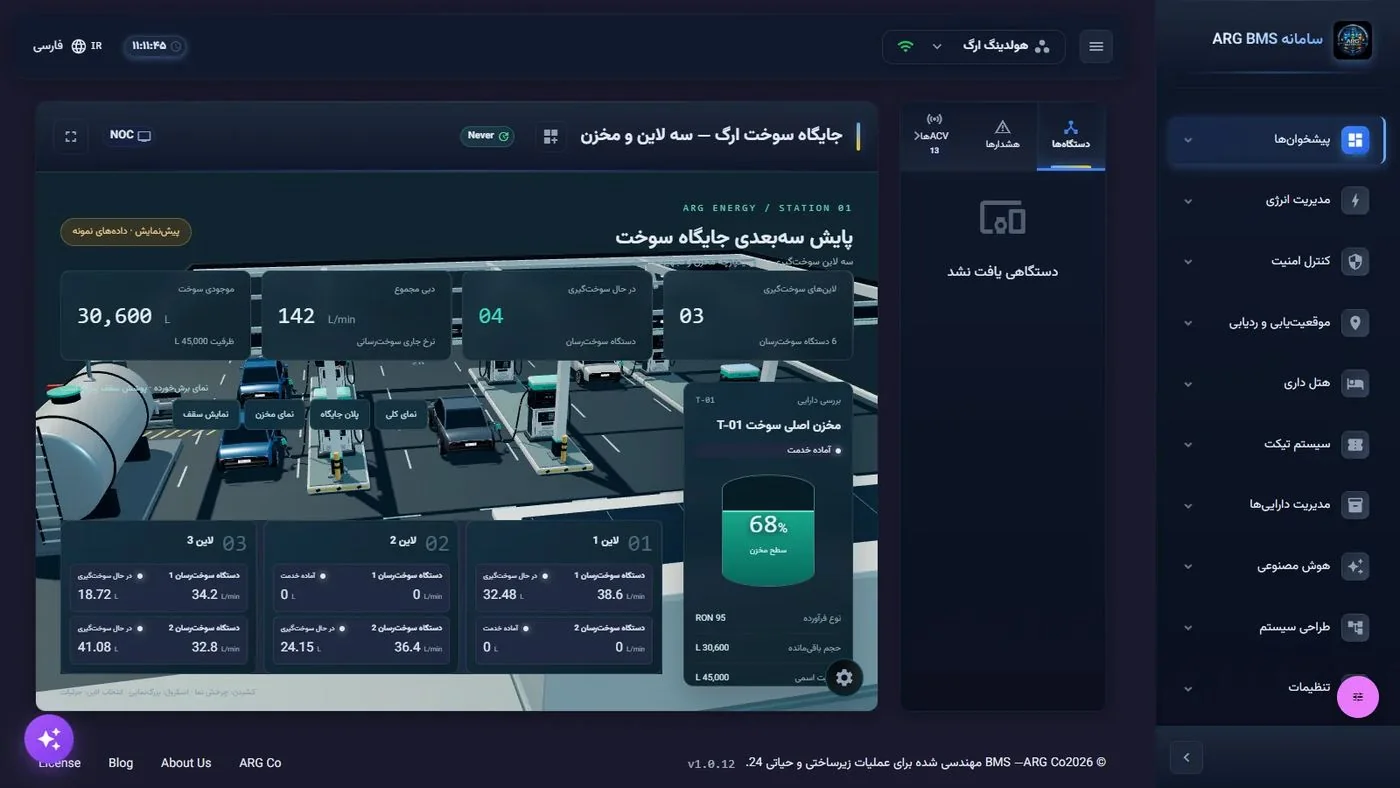
E · Writing and Testing a Rule
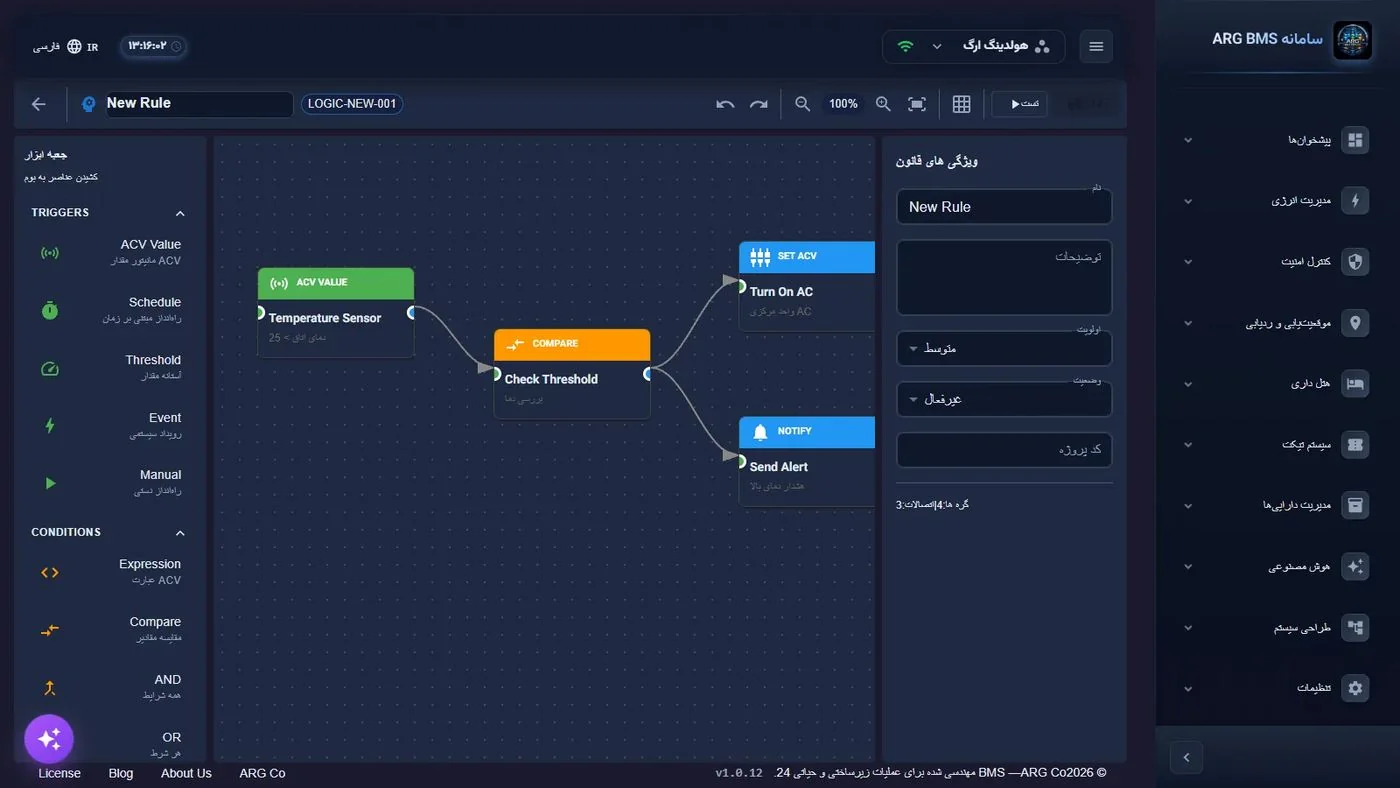
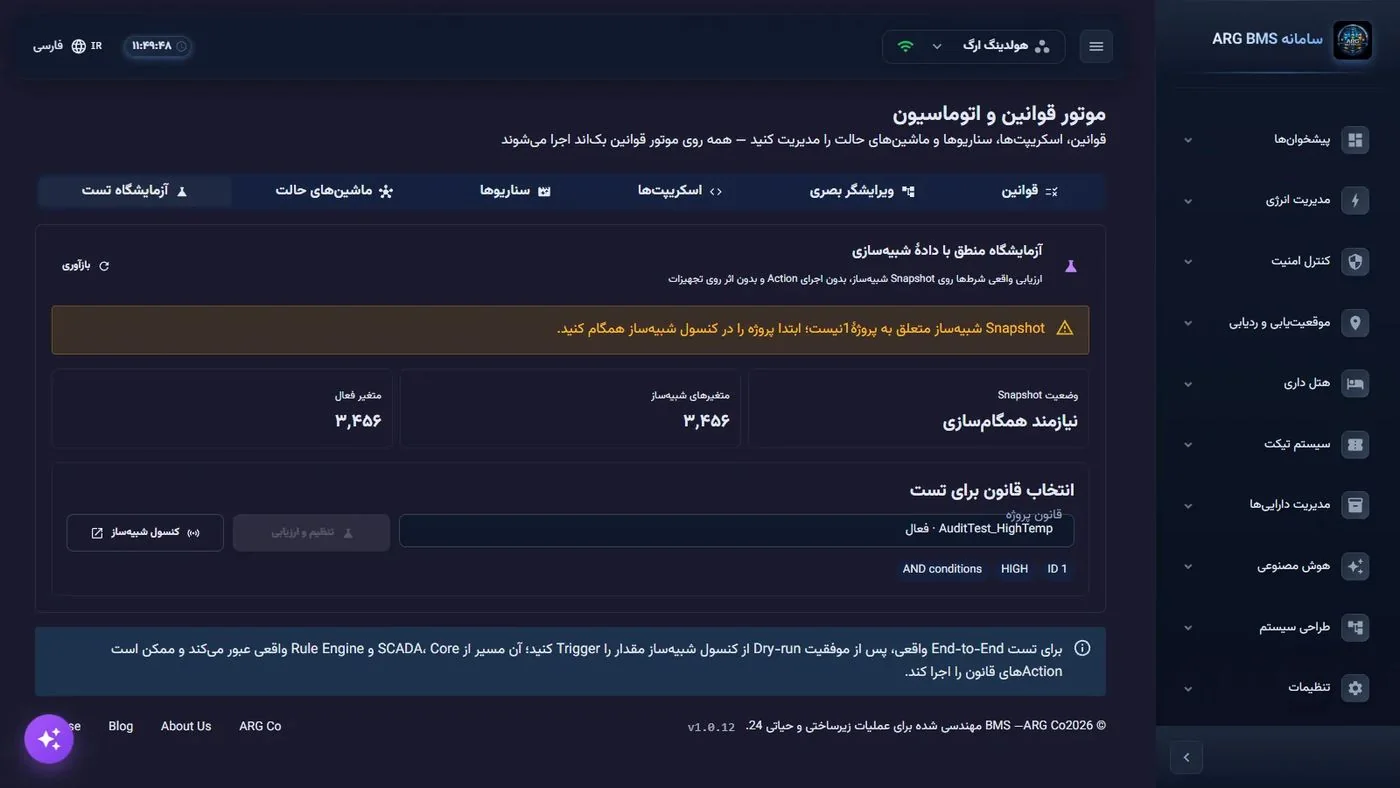
F · Setting Up SMS Notification and Escalation
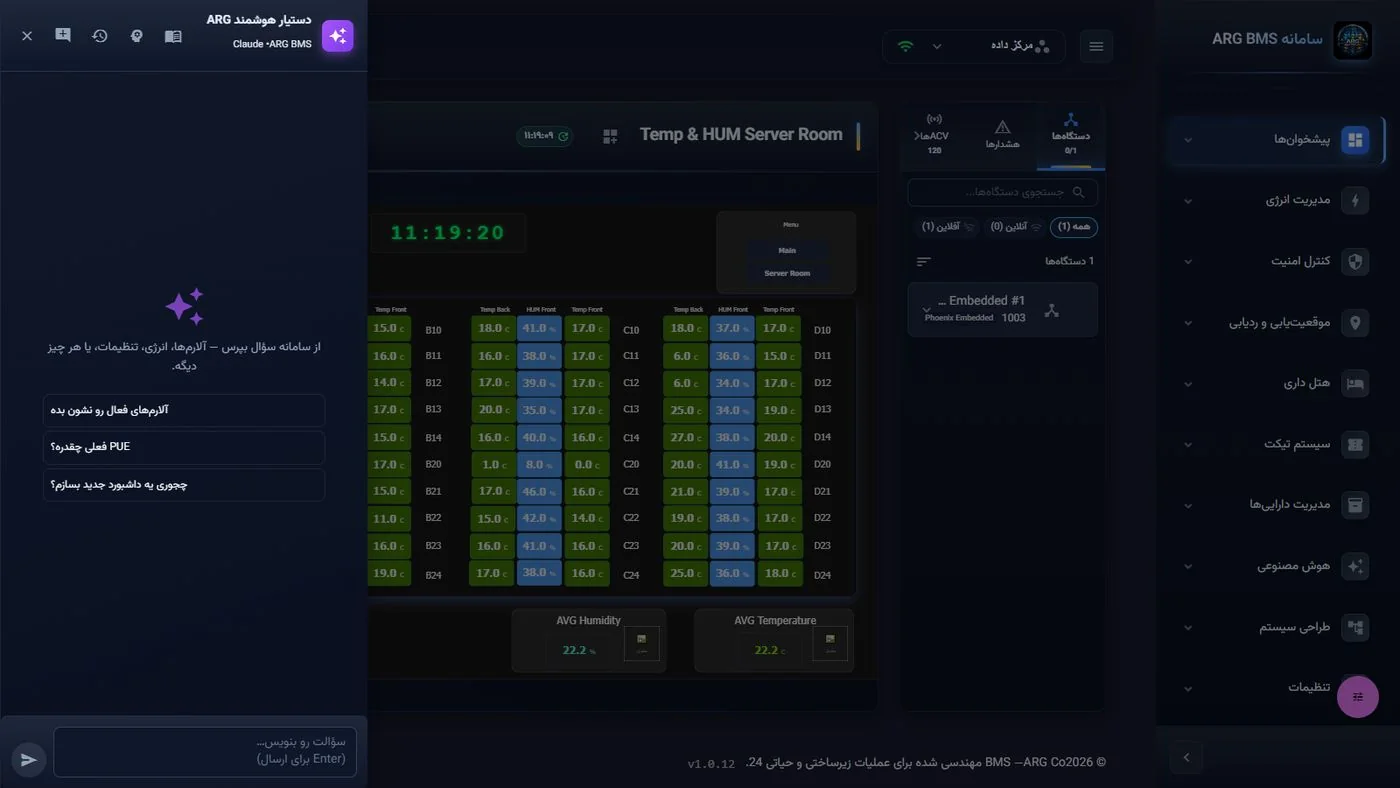
G · Conversing with the Assistant to Get Things Done
Data Model Reference — Types, Categories and States
Data Type and Point Direction
Data types: boolean, integer, float, enumerated, string. Direction: input (read-only) or output (command-capable). Output points are written through the protocol driver (SET, register, node, topic, datapoint).
Point Status
Inactive · Normal · Warning · Critical · Error. Warning/Critical are computed from two-level limits on each side (Low/LowLow, High/HighHigh); Error is for values outside the valid range or a failed read.
Point Types (55)
Digital and analog input/output, counter, timer, variable, time, system status, SMS, email, and equipment-specific types (UPS, generator, ATS, PDU, HVAC, access…).
Signal Categories (~500)
Sensors (temperature, humidity, CO₂, pressure, flow, level, vibration, light, occupancy…), generator (GEN_*), HVAC (AC_*), telecom (GSM_*), energy (ENERGY_*), mains/grid (MAIN_*), statuses and commands.
ID Base Ranges (Sample)
| Base | Meaning |
|---|---|
| 2000–2005 | Variable, date/time, timer, system status, SMS, email |
| 4000 · 5000 | Person, person group (physical access) |
| 6000–6800 | Equipment family: UPS, generator, ATS, PDU, AHU, FCU, chiller, boiler, elevator, access controller, parking controller, LPR camera, VFD… |
| 9000–9011 | AC, SNMP (9004), Modbus (9005), KNX (9006), BACnet (9007), LonWorks (9008), M‑Bus (9009), PLC (9010), Redfish (9011) |
| 9024–9027 · 9065 | S7, FINS, MC, ADS · Tuya |
Hierarchy and Related Entities
Project (keys, settings, profile) → organization → building → floor → space → equipment (group, serial, catalog model, protocol) → point. Related entities: dashboards (2D/3D/list/map, owner, sharing), media, rules/limits/scripts/state machines/scenarios, notification channels/groups/templates, escalation policies, events, assets, tickets, meters/tariffs, UPS/battery nodes, people/roles/permissions, twins and twin events.
Roadmap
Items that this document does not claim as existing capabilities, and that are on the development roadmap.
| Item | Status |
|---|---|
| Active-active clustering of the application layer and horizontal collector nodes | Planned Today: database HA, standby-ready nodes, splitting a site into independent units |
| A multi-threaded ingest path for refinery-scale volume (hundreds of thousands of points with second-level updates) | Planned The distribution engine today handles ~70,000 updates per second; the full processing path is being optimized |
| BACnet/IP and MS/TP, KNX, M‑Bus | Planned The UI, data model and polling loop are ready; the protocol layer is being completed |
| PLC: OPC UA inside the PLC driver, Beckhoff ADS | Planned (standalone OPC UA is already complete) |
| Generic twin types on the server (chiller, pump, AHU) | Planned Today they exist in Twin Designer and the UI layer; the server runs the UPS type |
| Live data connectivity for the hotel, production and agriculture modules | In development Pages and workflow are ready; the connection to points and server entities is being completed |
| Dedicated pages for solar, water, EV charging, fleet, indoor positioning, and fire suppression with live data | In development The UI is complete on sample data; real monitoring is possible through the generic point model |
| A native mobile app and full offline mode (PWA) | Planned A responsive web version and the ARG AI mobile API already exist |
| A 3D globe map inside the system (Cesium/Mapbox) | Planned A 2D map with 8 tile sources, and a 3D globe on the offline map server, are already active |
See the Digital Twin live
The live ArgBMS demo with real 3D twins, dashboards and logic.