Dashboards & 3D scenes
Real-time monitoring on 2D dashboards and 3D scenes, the no-code dashboard designer, the 3D scene builder and twin types with Twin Designer.
Real-Time Monitoring and Dashboards
Values flow from device to user screen over a project-scoped WebSocket channel: points visible on screen update at high priority (every 100 milliseconds), while the rest update at a lower rate (600 milliseconds) so that point-heavy pages still stay smooth. If the network or a proxy blocks WebSocket, the system automatically falls back to periodic polling (every 8 seconds) without losing anything; a 5-second heartbeat, exponential reconnection and zombie-connection detection keep it stable on unreliable networks.
Four Dashboard Types
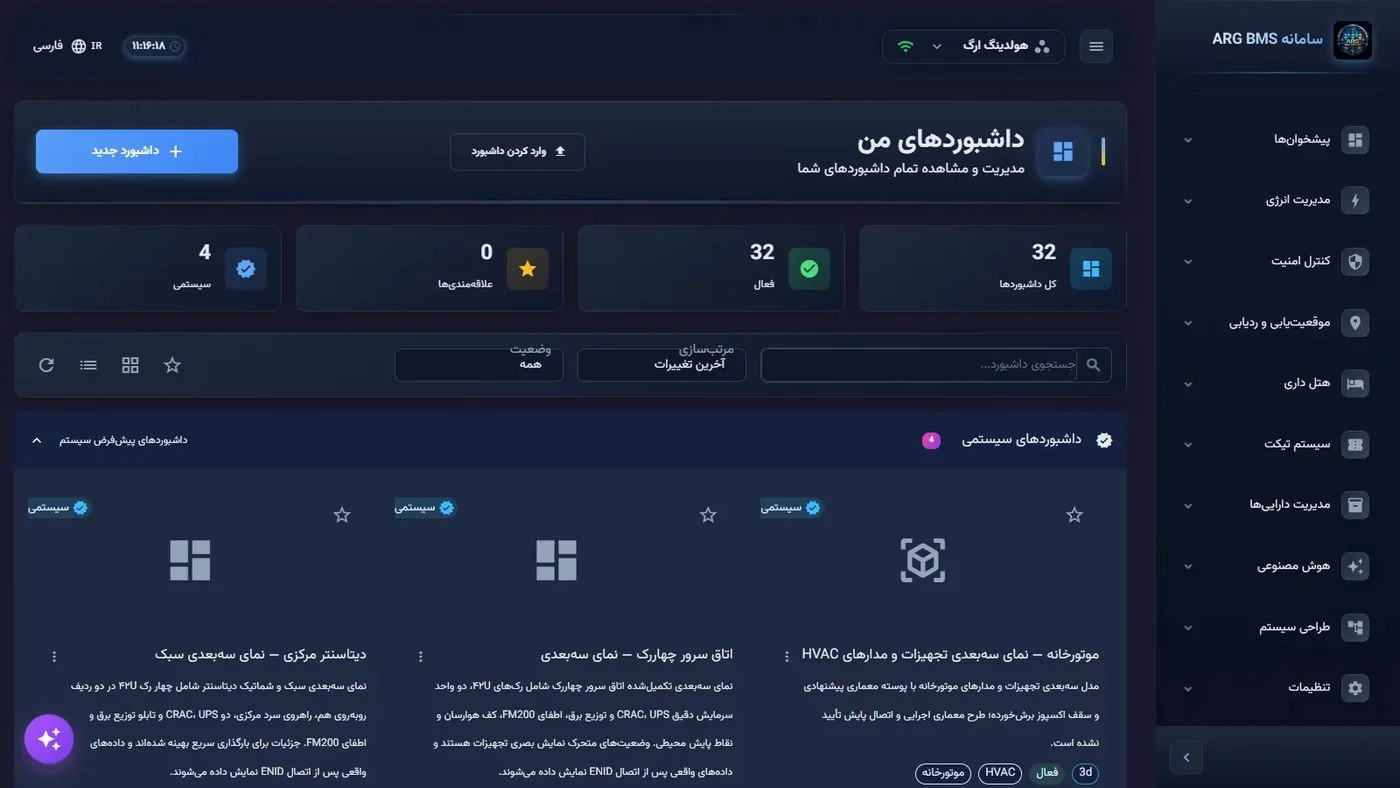
- 2D: free-form design with the dashboard designer (Chapter 9)
- 3D: a scene built in the 3D scene builder (Chapter 10)
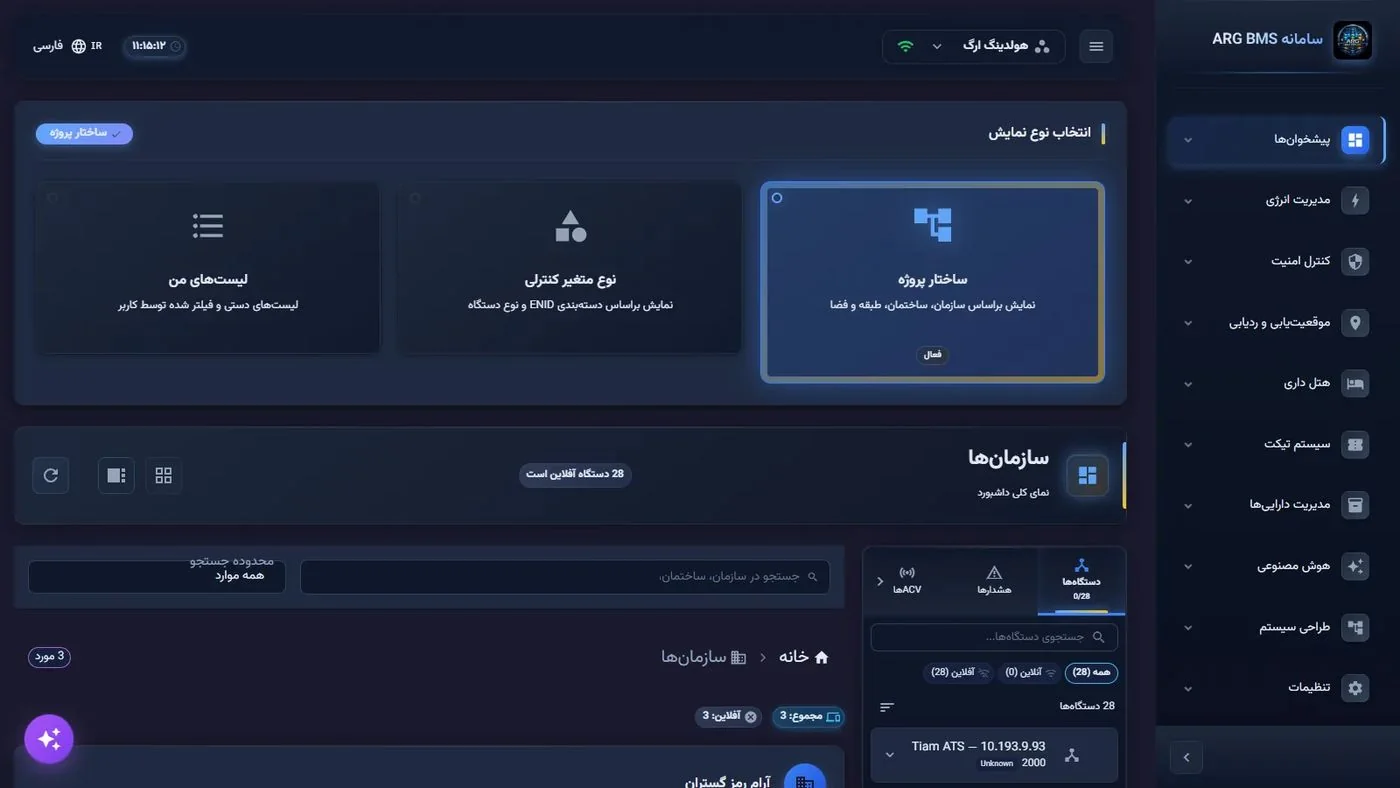
- Automatic list: built from the project structure with no design work
- Map: devices and sites on an online or offline map (Chapter 15)
Display Capabilities
- Default, recently opened and favorite dashboards; dashboard sharing and cloning
- Full-screen view for control room video walls; mobile side menu
- Offline browser cache (IndexedDB) for last values, metadata, history and user settings
- Operational room/plant views with data-quality labels: fresh, stale, unavailable, invalid, disconnected
- Per-point history with independent, monthly-partitioned storage for each project; charts ranging from 1 minute to 7 days
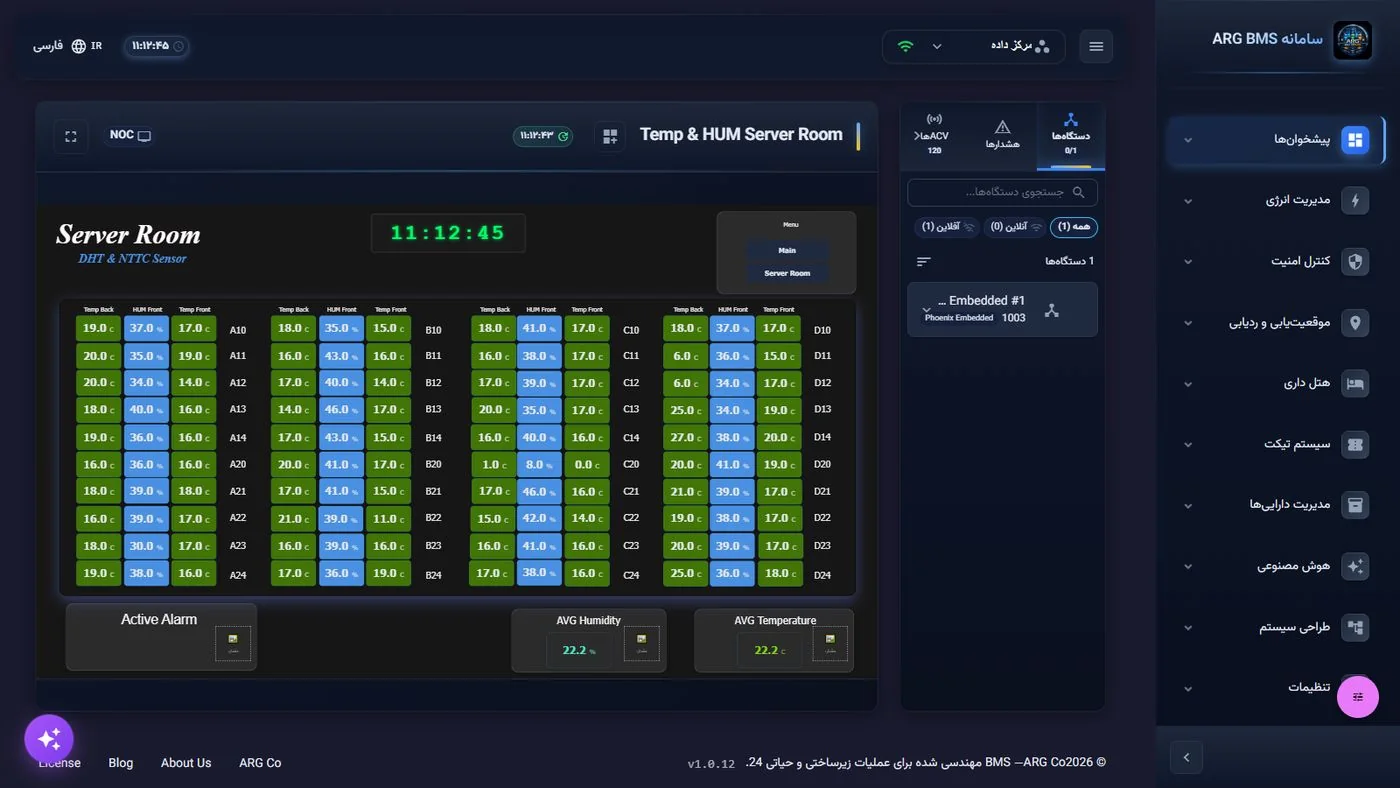
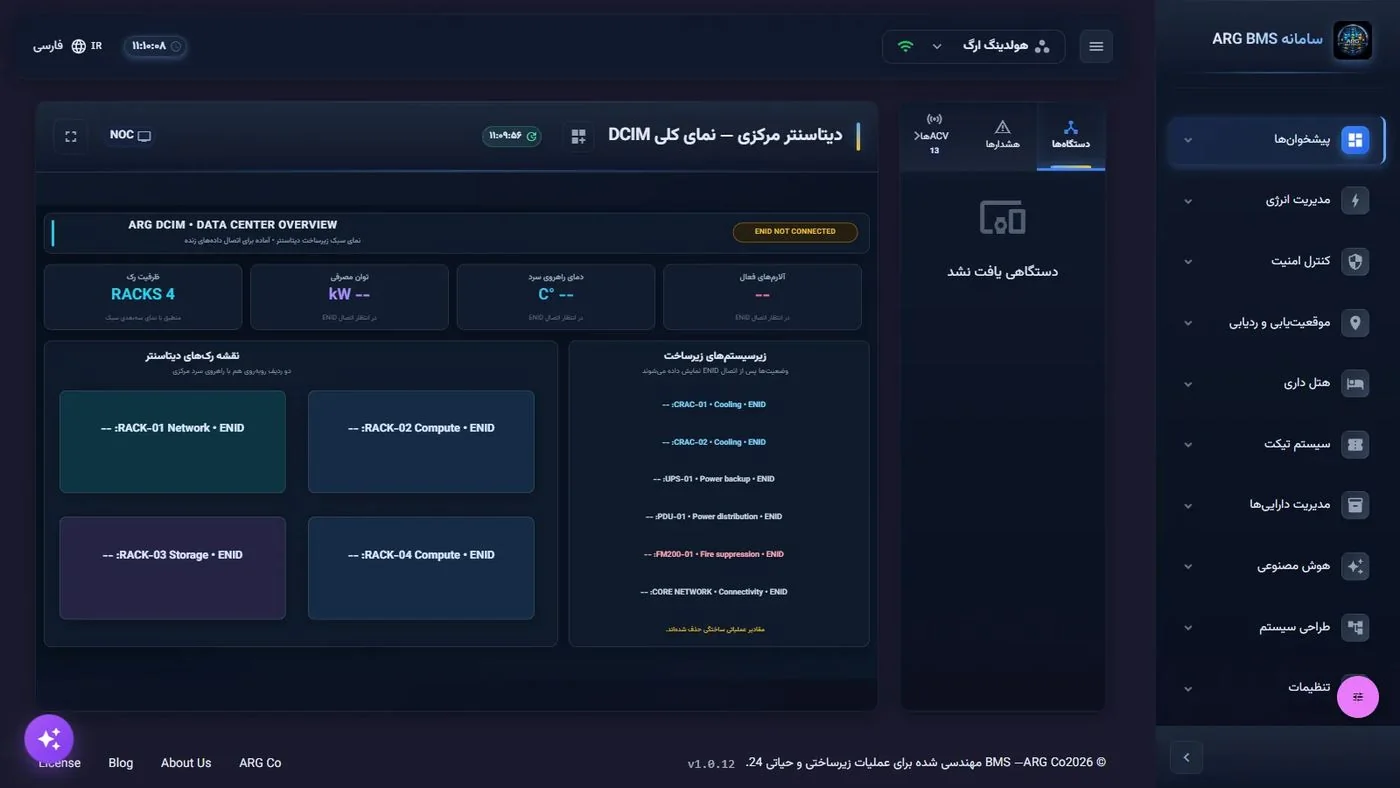
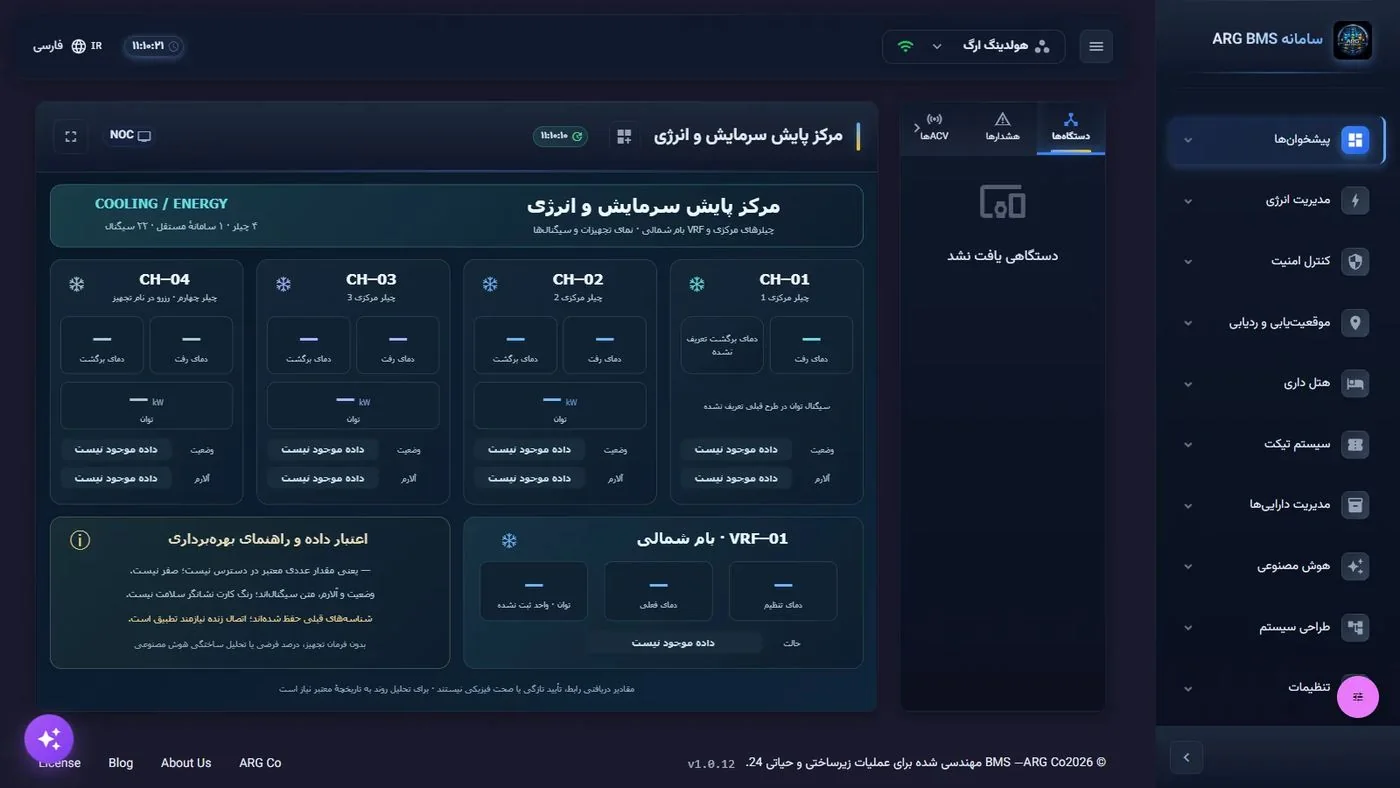
2D Dashboard Designer
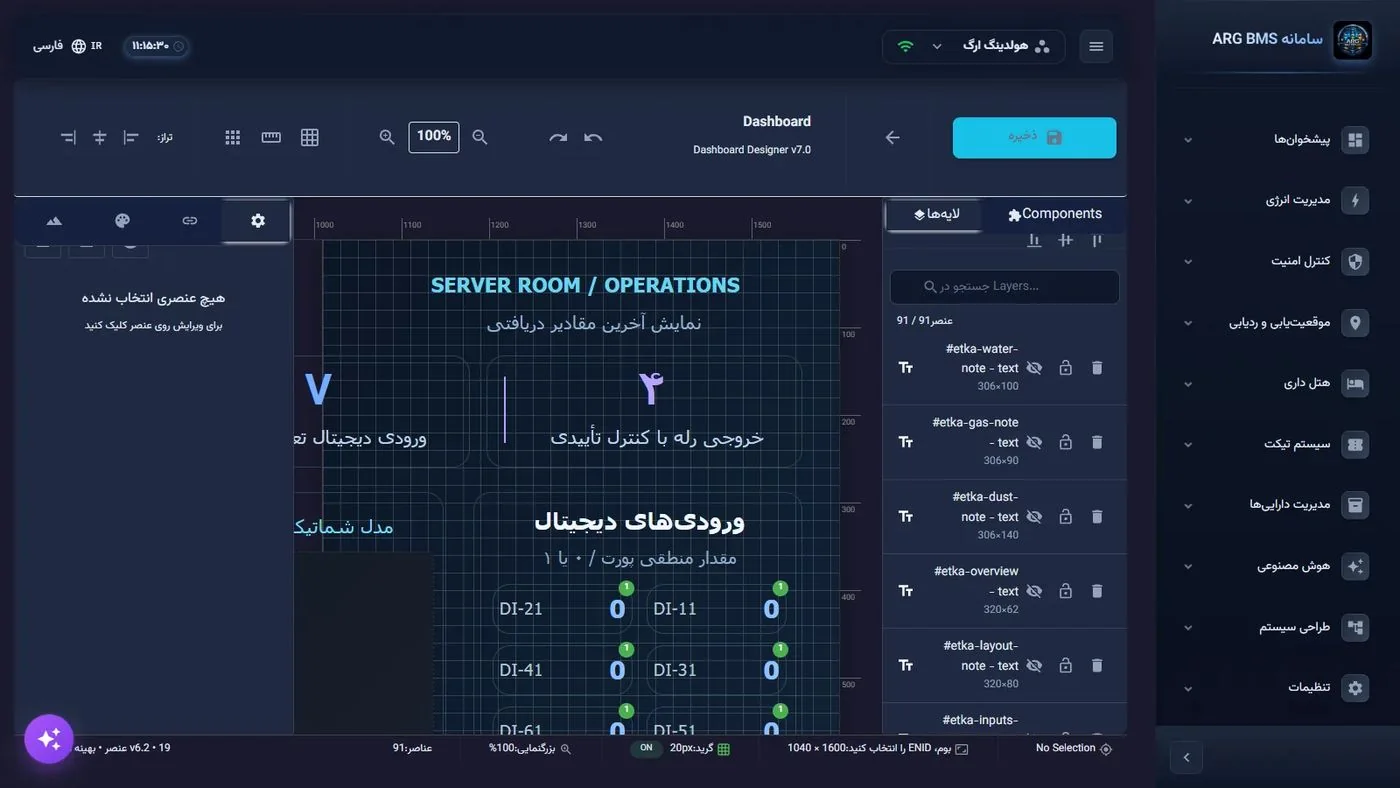
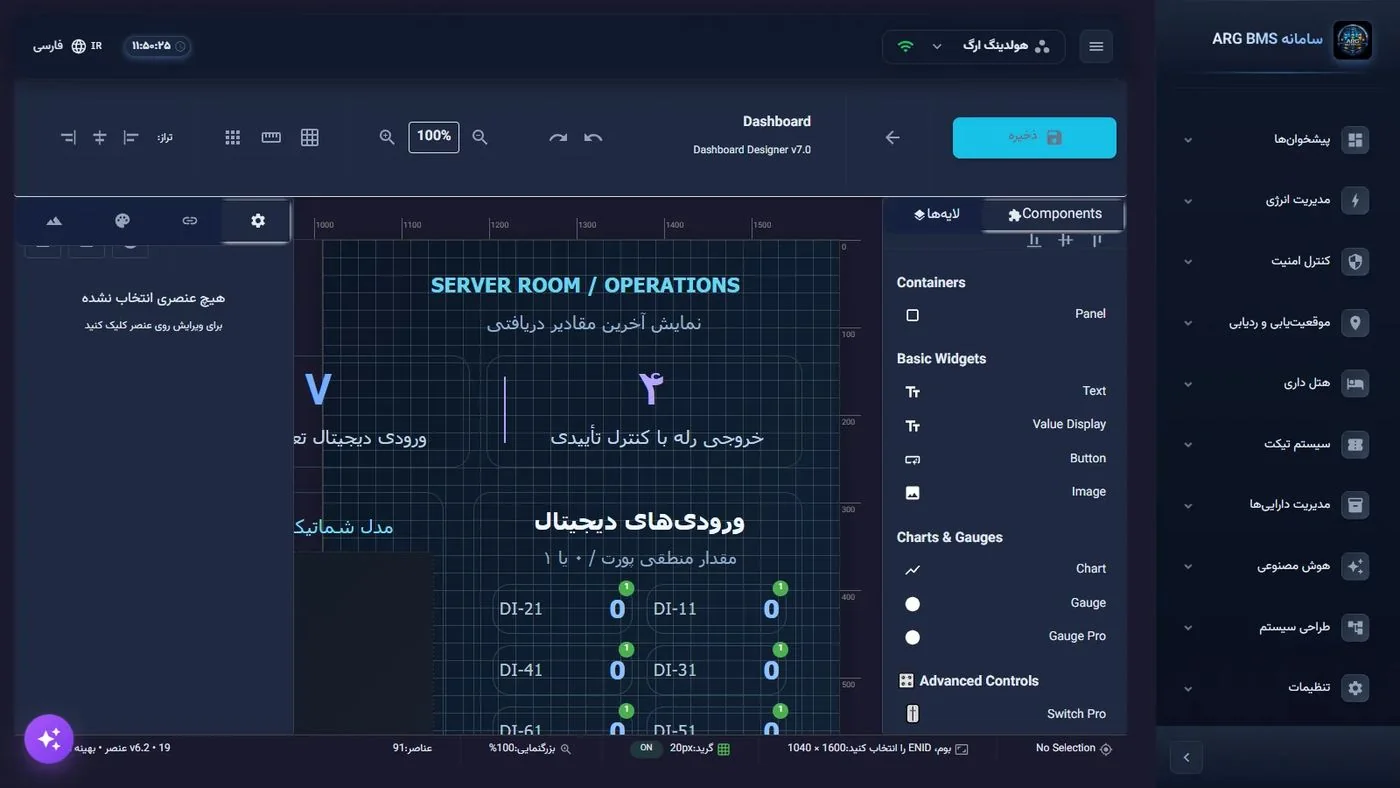
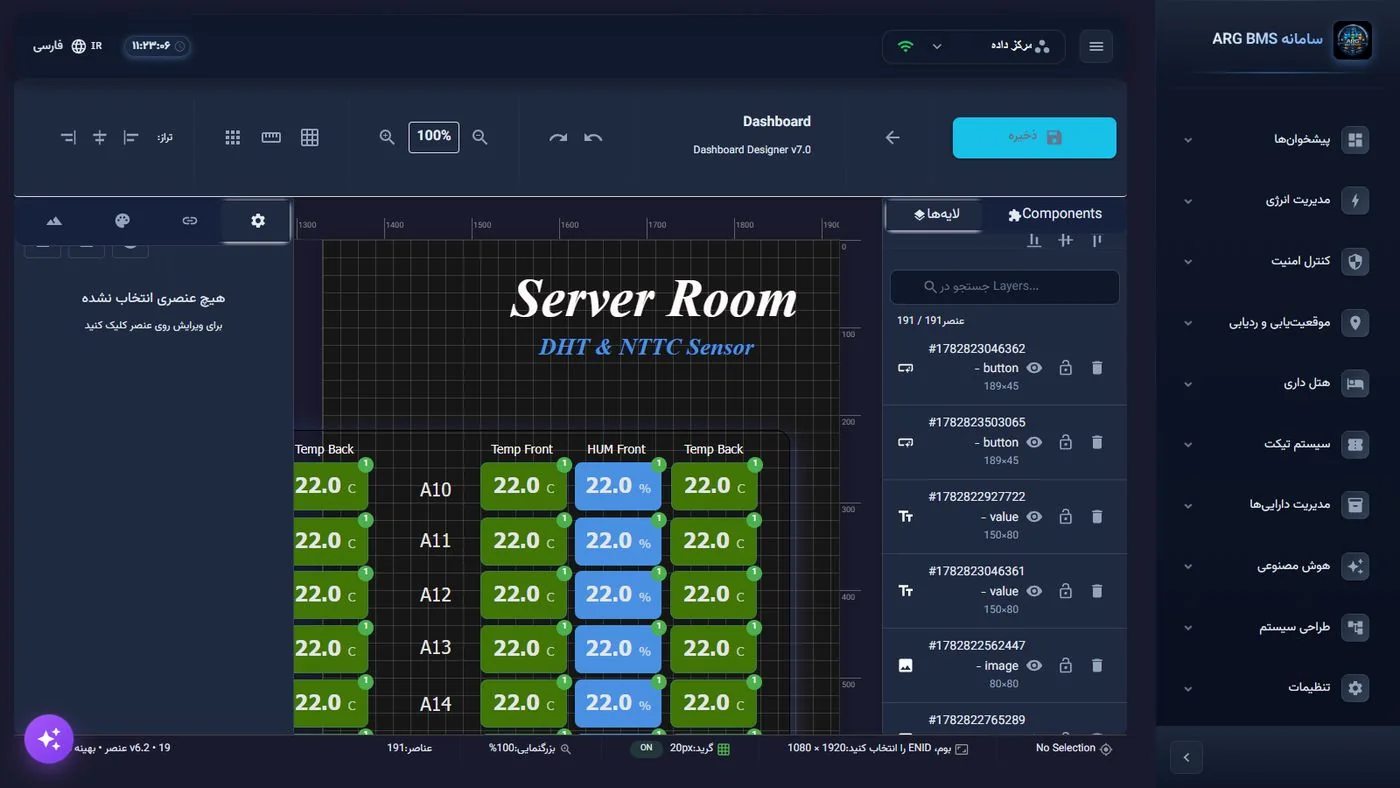
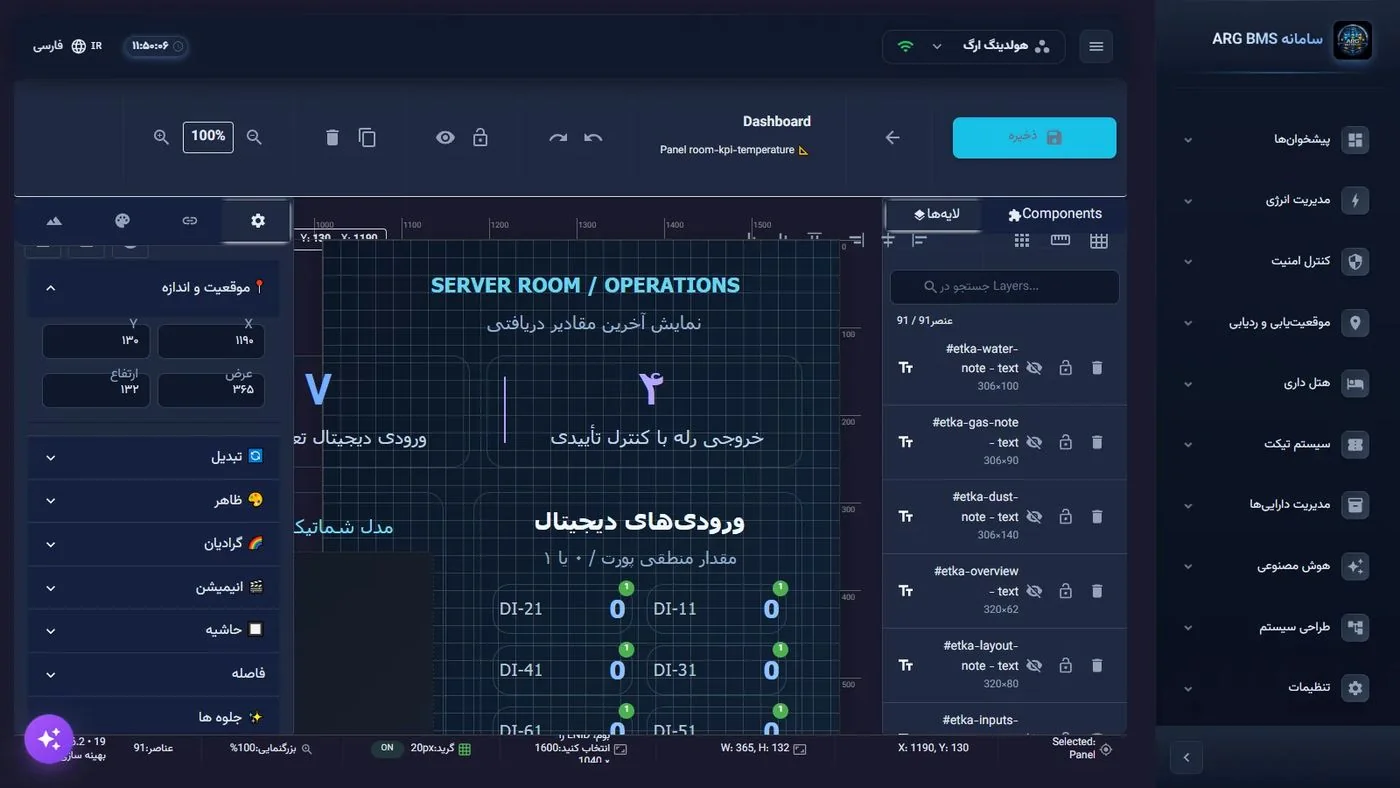
A drag-and-drop canvas editor in which every element binds to one or more real points and comes alive at runtime with that same appearance. No-code design, with live preview of values.
| Category | Elements | Use |
|---|---|---|
| Container | Panel | Grouping, background, border, layering |
| Basic | Text, value, button, image | Displaying a value with unit and font; momentary/latching button for commands |
| Chart and gauge | Time chart, gauge, professional gauge | Range from 1 minute to 7 days, max points, grid |
| Advanced control | Switch, slider, volume, thermostat | Writing to output points with control permission |
| Media and display | Web view, camera, animation | External page, camera stream, simple animation |
| Navigation and time | Dashboard link, clock, weather | Moving between dashboards, control-room clock |
| Equipment | BMS animations (153 across 16 categories), photorealistic equipment (144) | HVAC, pump, fan, valve, pipe, tank, meter, arrow, wiring, electrical, fire suppression, sensor, status, access, agriculture… with value-driven color/speed/level/opacity |
| 3D | 3D object, embedded scene | Displaying a 3D scene inside a 2D dashboard |
| Data display | Advanced list, device monitor | Custom tables, device card with history |
Design Tools
- Grid, ruler, snapping, zoom, alignment, layers, lock and hide
- 50-step history (undo/redo), autosave every 30 seconds, clipboard
- Keyboard shortcuts: copy/paste/duplicate/delete/fine-grained nudge (10 and 1 pixel)
- Image or floor-plan background; media library
Professional Features
- Mapping value to color, speed, level and opacity (discrete or range-based)
- Aggregating multiple points into one element (average, maximum, minimum…)
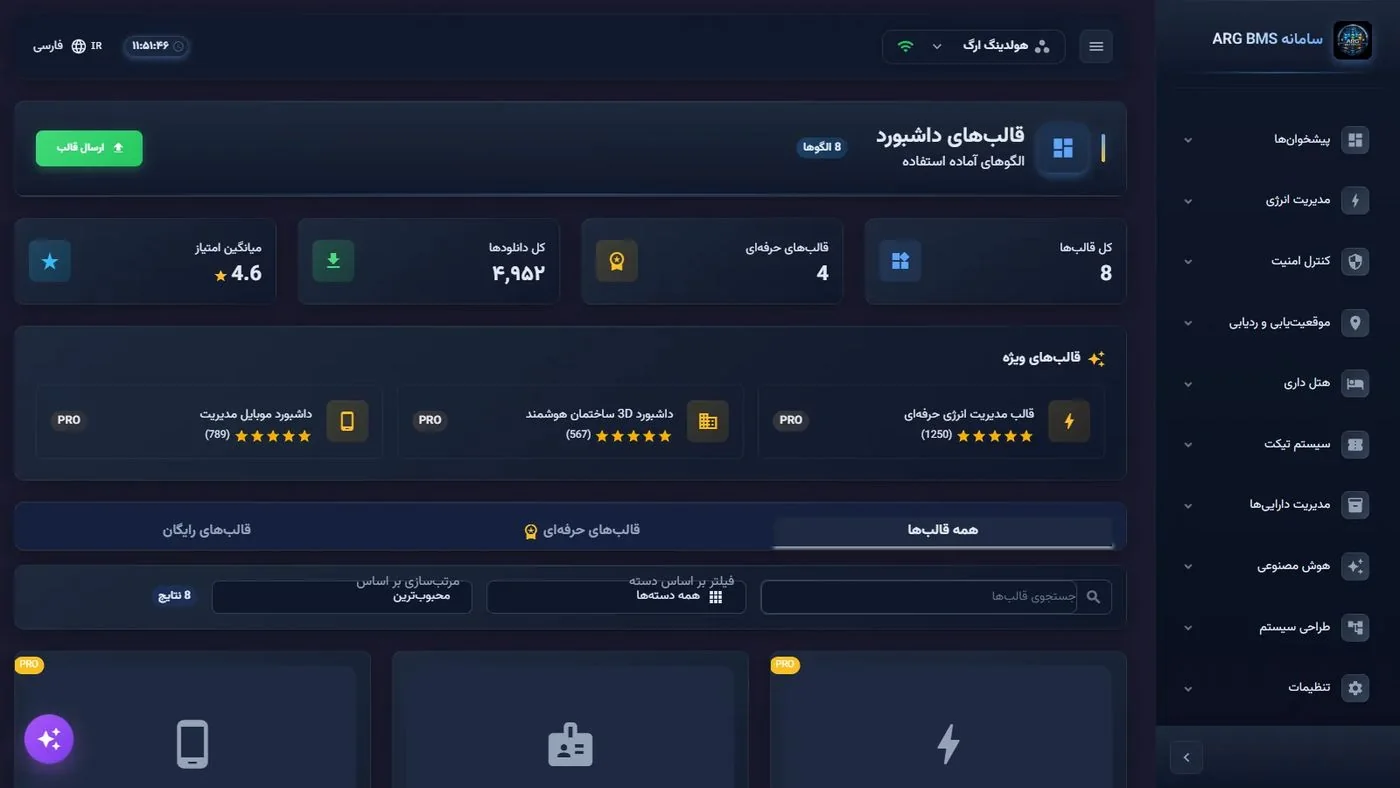
- Export/import dashboards to ZIP (with media) or JSON; 8 ready-made templates
- The AI assistant sees the open canvas and applies suggested elements with a single click (and a single undo)
Scene Builder and 3D Twins
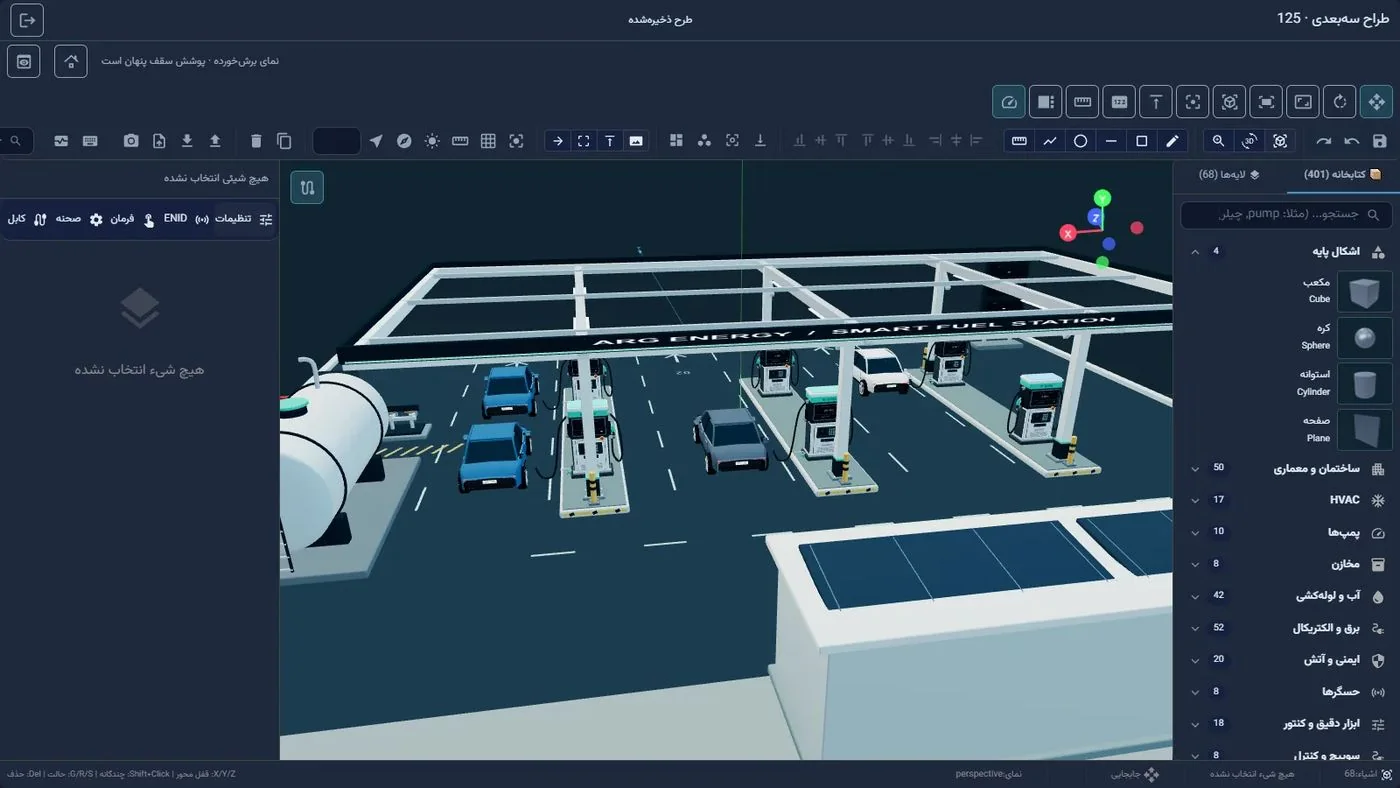
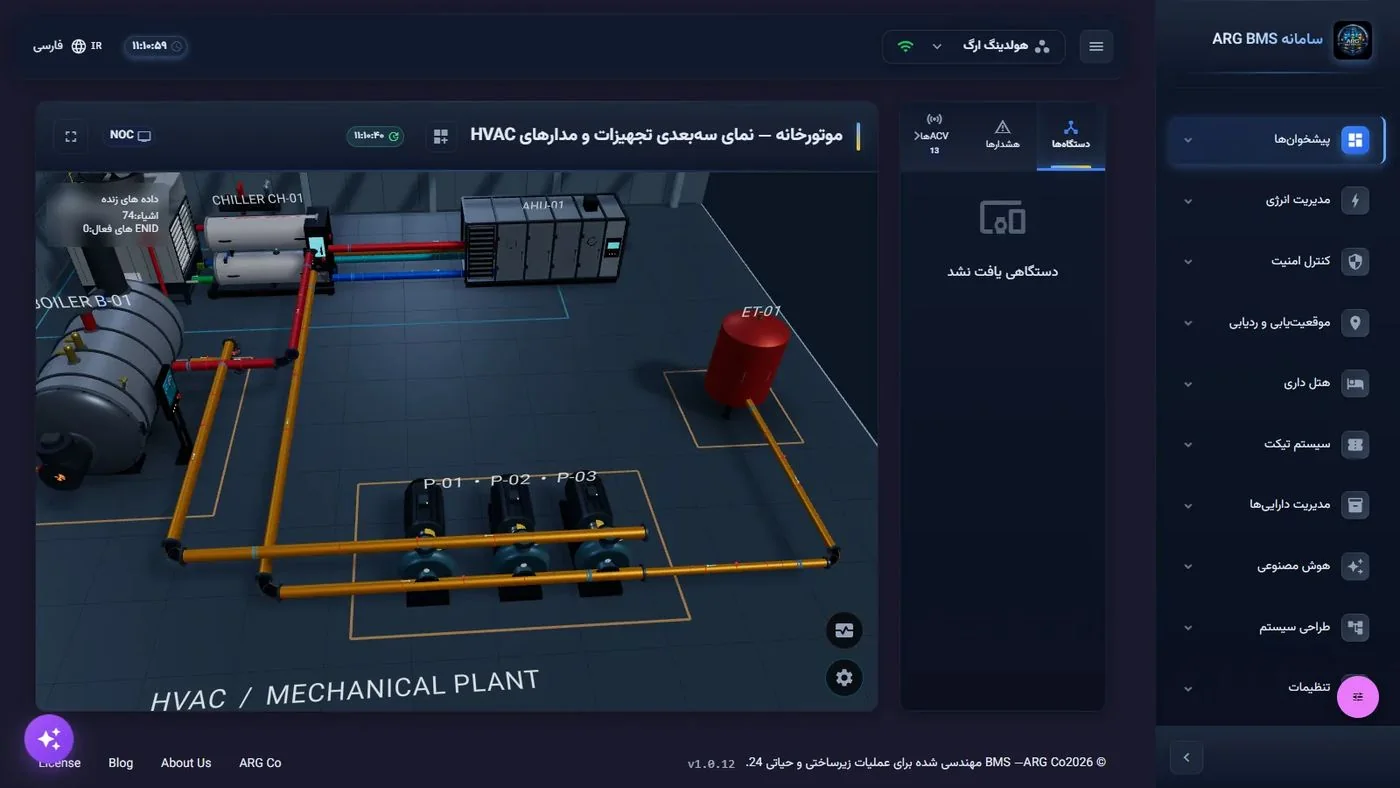
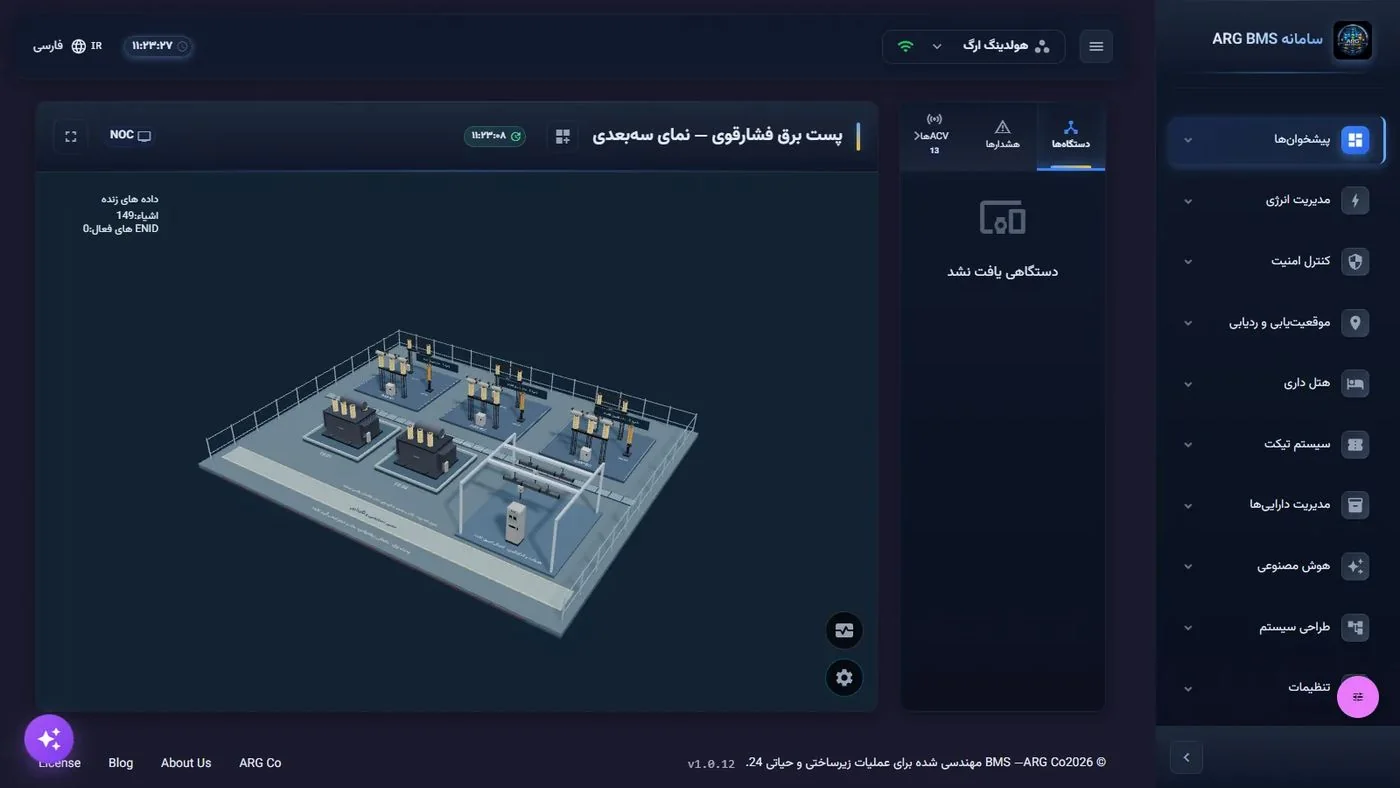
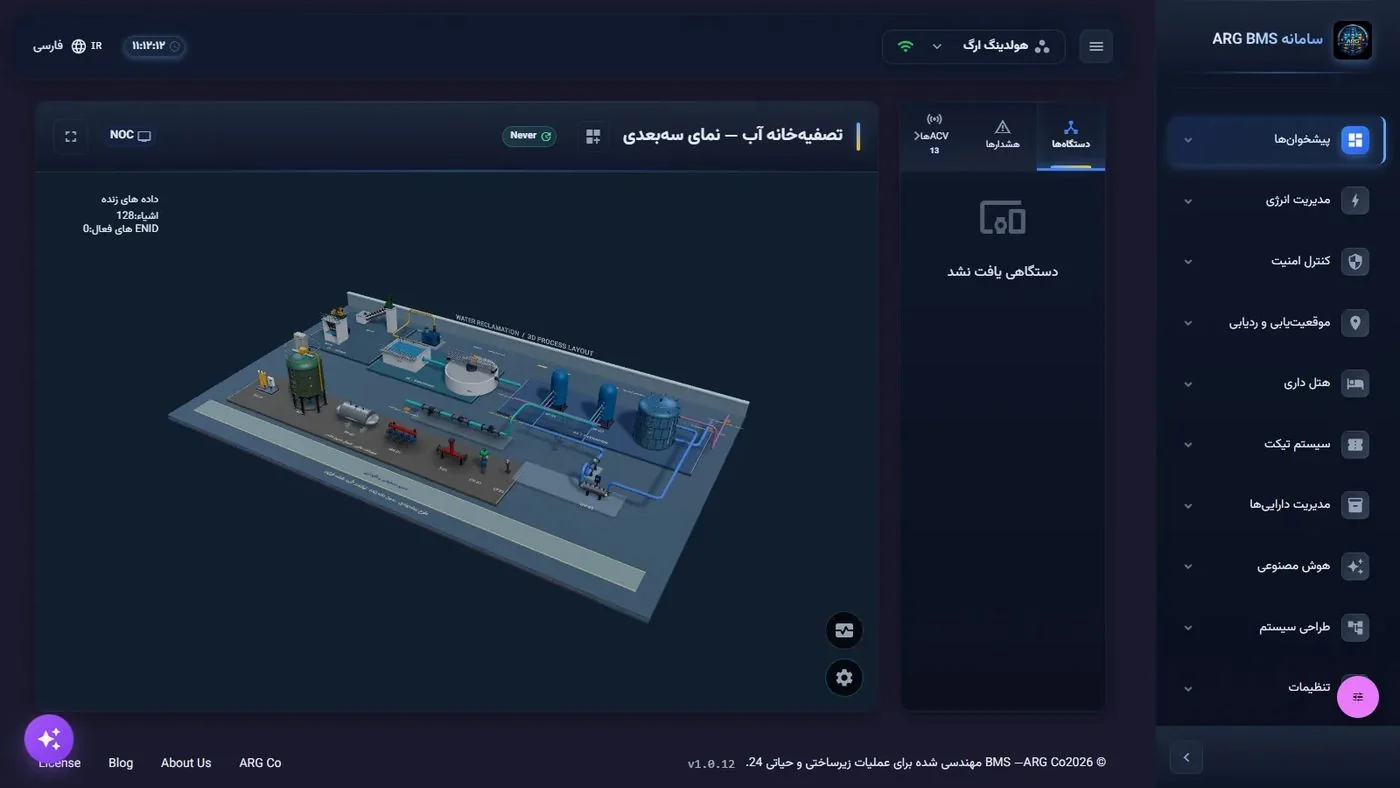
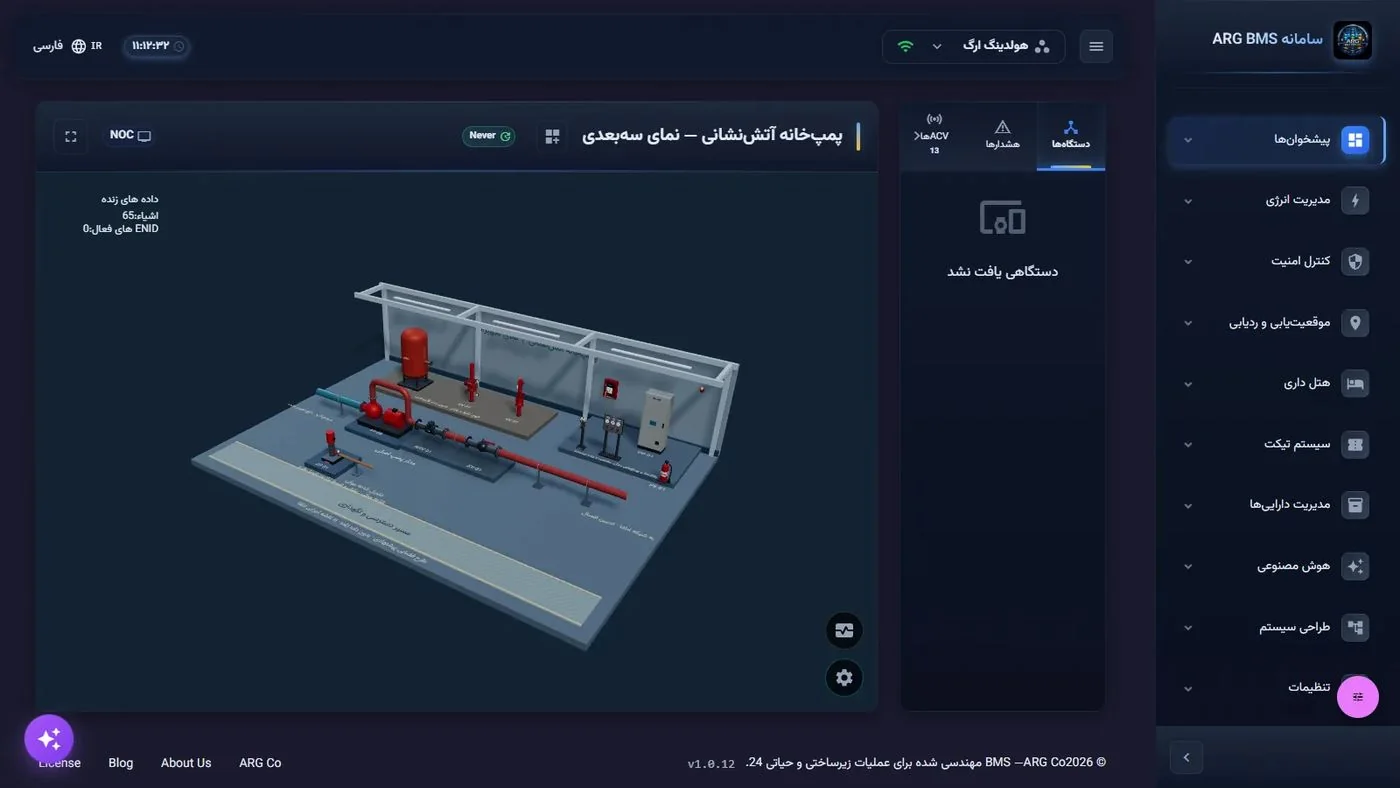
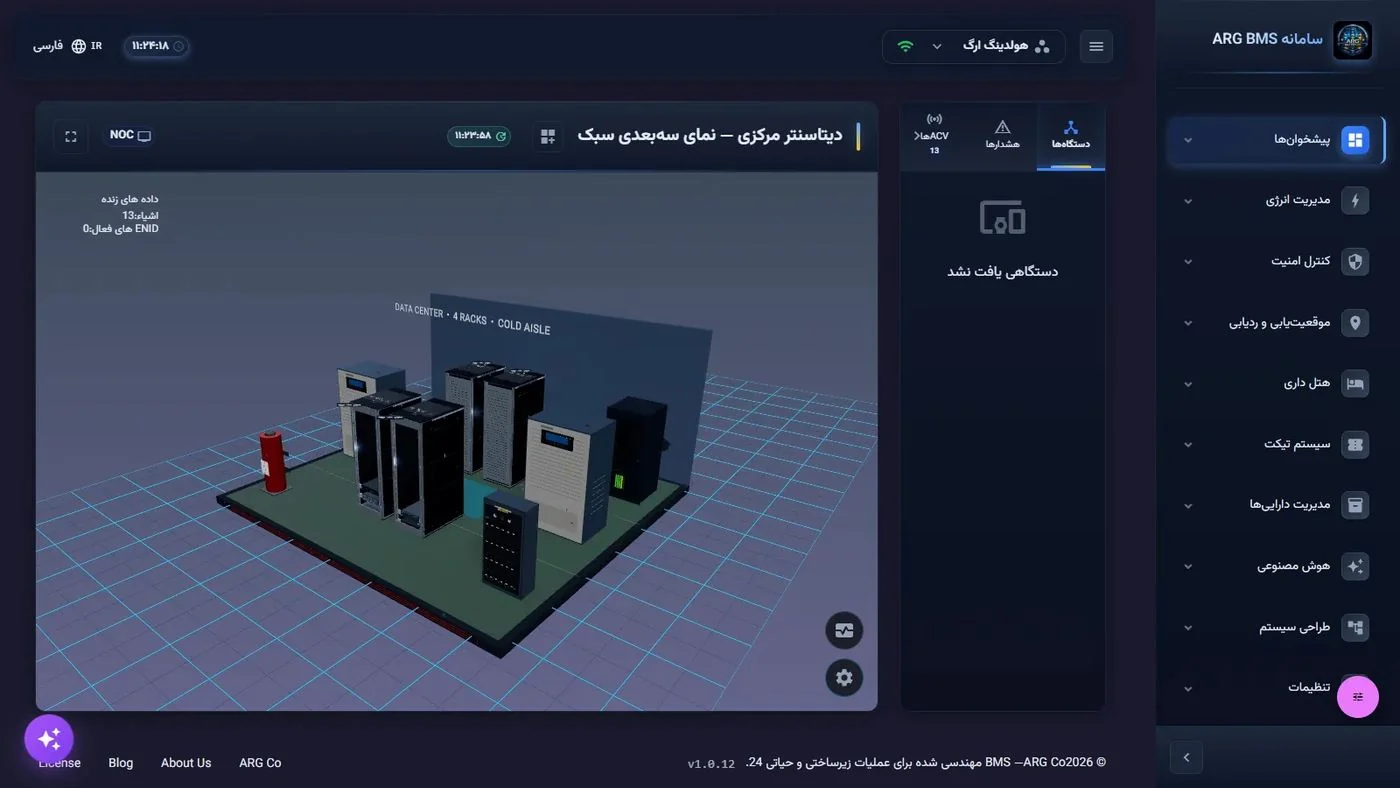
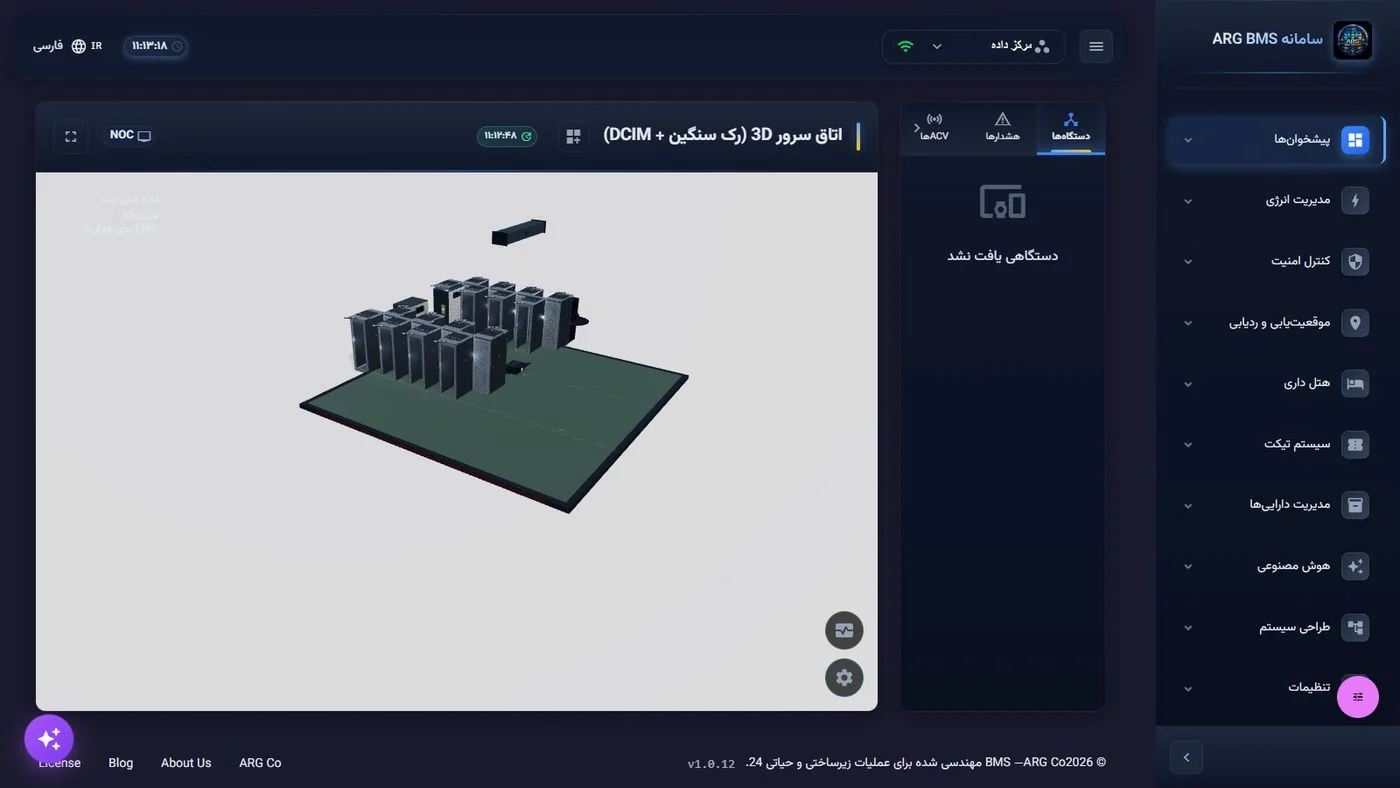
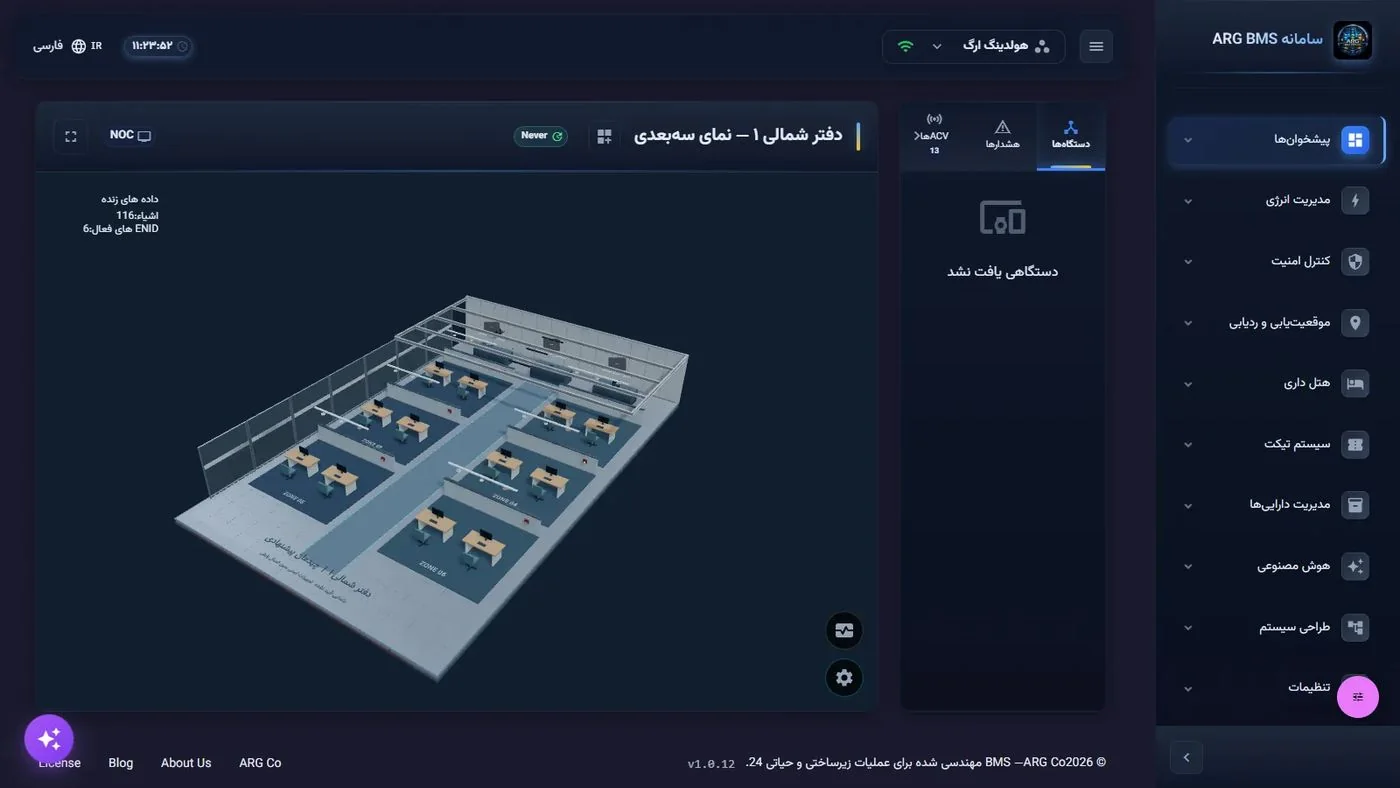
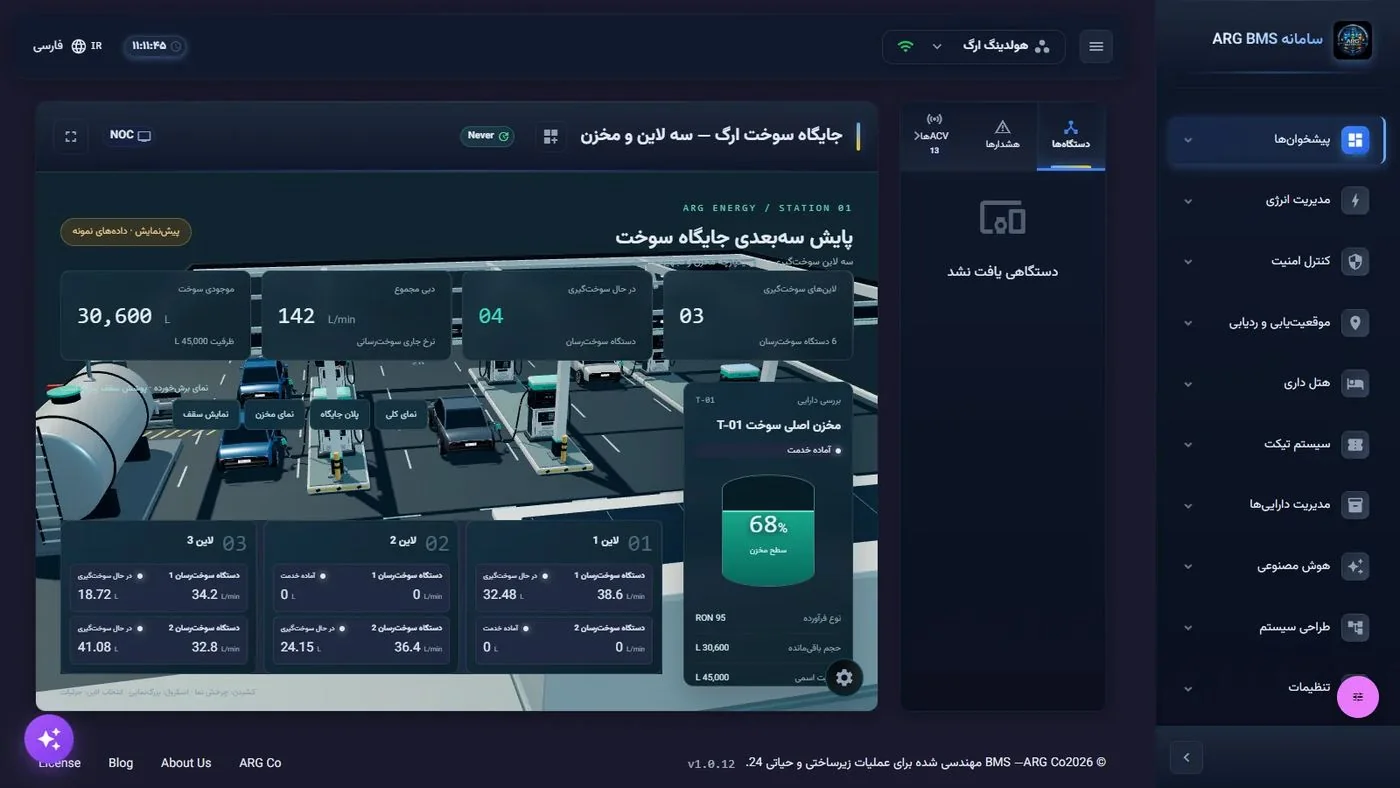
A full-screen 3D environment for building the spatial counterpart of a site: server room, boiler room, electrical substation, treatment plant or fuel station. Each object binds to real points, and its color, intensity, rotation or fill level changes with the live value; that same scene is displayed on the dashboard live and can be rotated.

Object Library (29 categories, 167 items)
Refinery and petrochemical · Fuel station · Building and architecture · HVAC · Pumps · Tanks · Electrical and power · Sensors · Fire safety and suppression · Switches and controls · Server room and DCIM · Access and security · Roads and infrastructure · Wiring and conduit · Flow and arrows · Airport · Hospital · Equipment · Basic shapes. 92 object templates and 400 thumbnail images. External model upload (GLB/GLTF/FBX/OBJ/STL) up to 50 MB with Draco compression.
Modeling Tools
- Perspective, front, top, side and isometric views; preset cameras
- Move/rotate/scale with a gizmo or numeric value; axis lock; alignment
- Snapping to grid, to objects and to connection ports (SketchUp-style); snap to floor; snap distance
- Material and lighting editor; precise dimensions; rack and in-rack equipment configuration
- 50-step history, autosave, scene export/import
Connections and Routing
Connection, snapping and piping modes; pipe, air duct, cable and conduit with elbows and multi-point routing; loop detection and collision warnings; standard pipe color coding.
Data Binding and Commands
Every object: bound points, mapping of value to visual properties, multi-point aggregation, and commands (on/off, value) with secure confirmation. Ready-made twin templates: fuel station, process twins, fire pump room, electrical substation, dispatch room, server room.
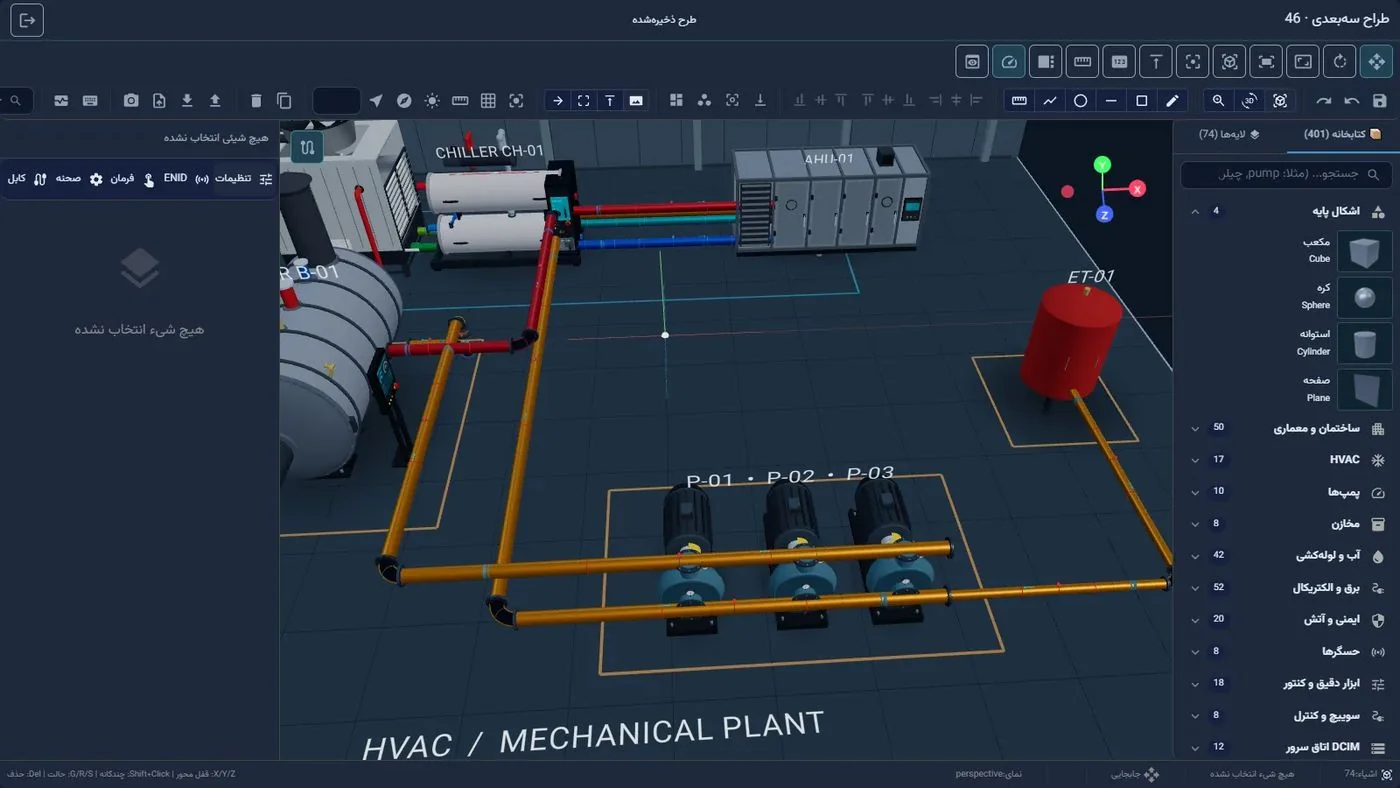
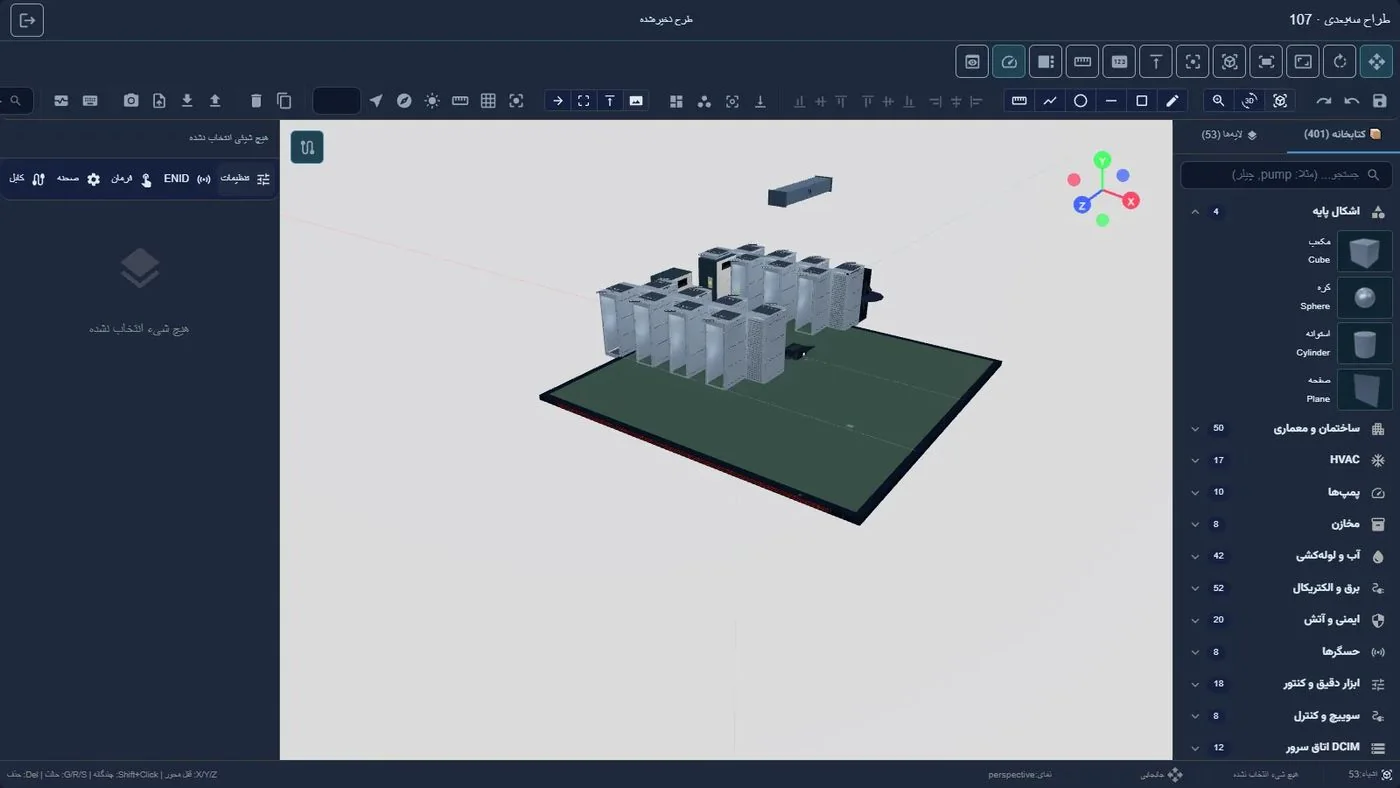
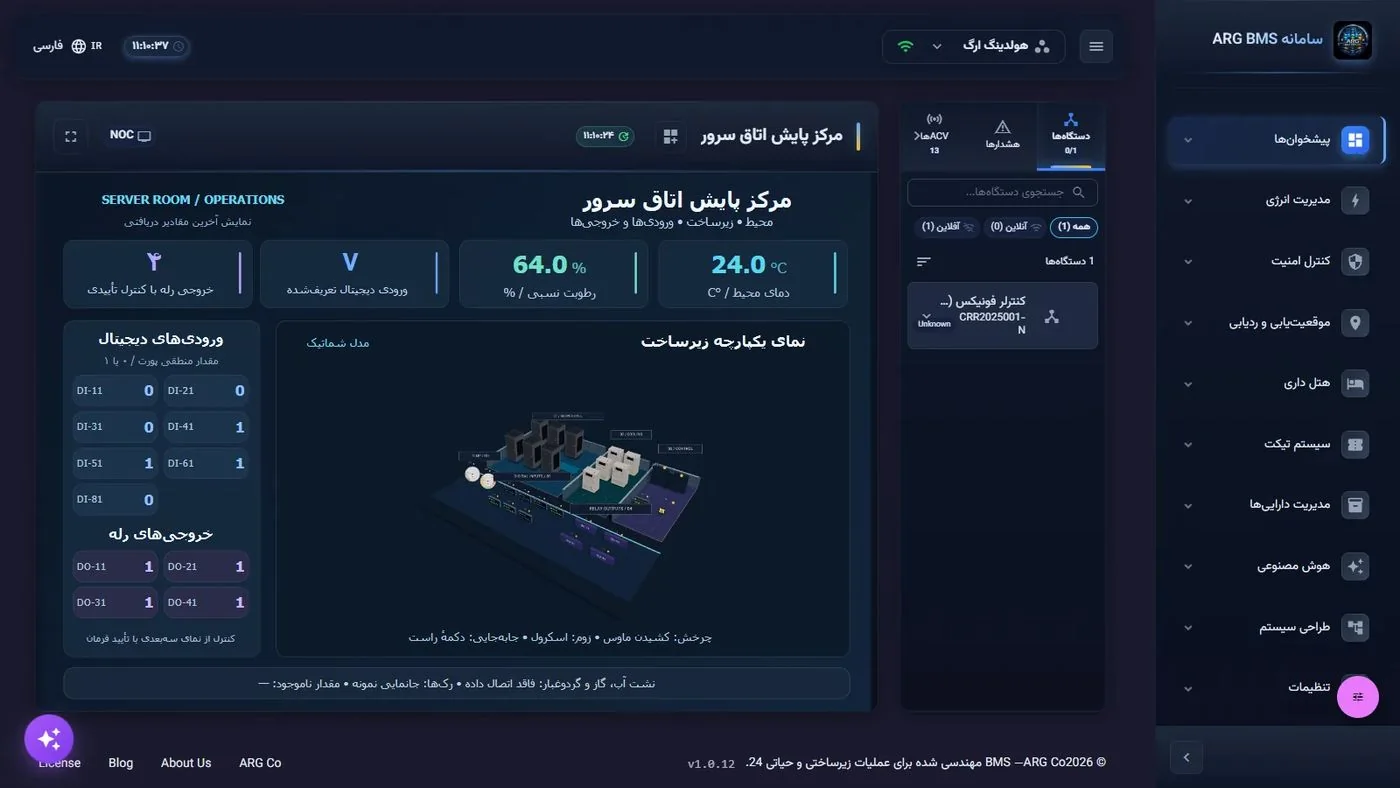
Live 3D Twins — Examples
Twin Types and Twin Designer
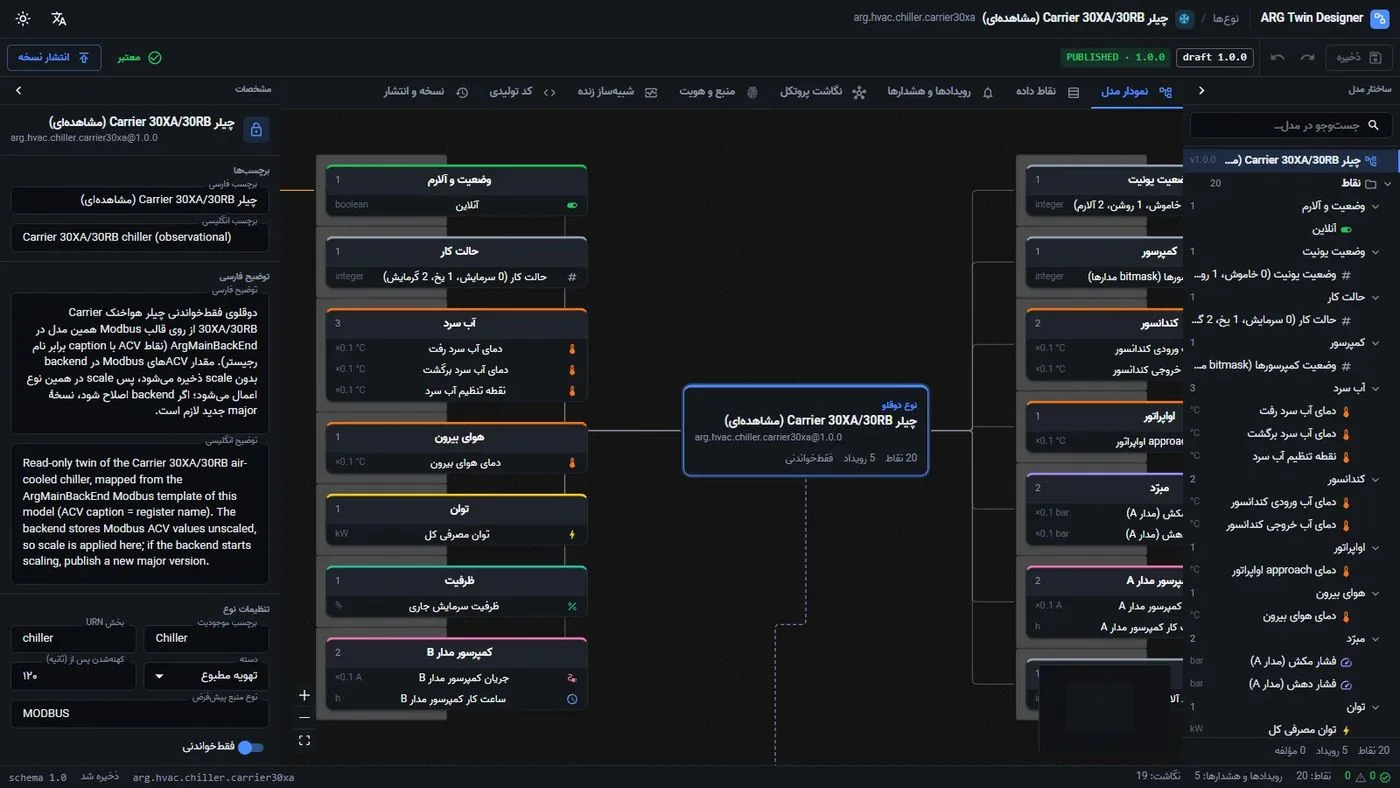
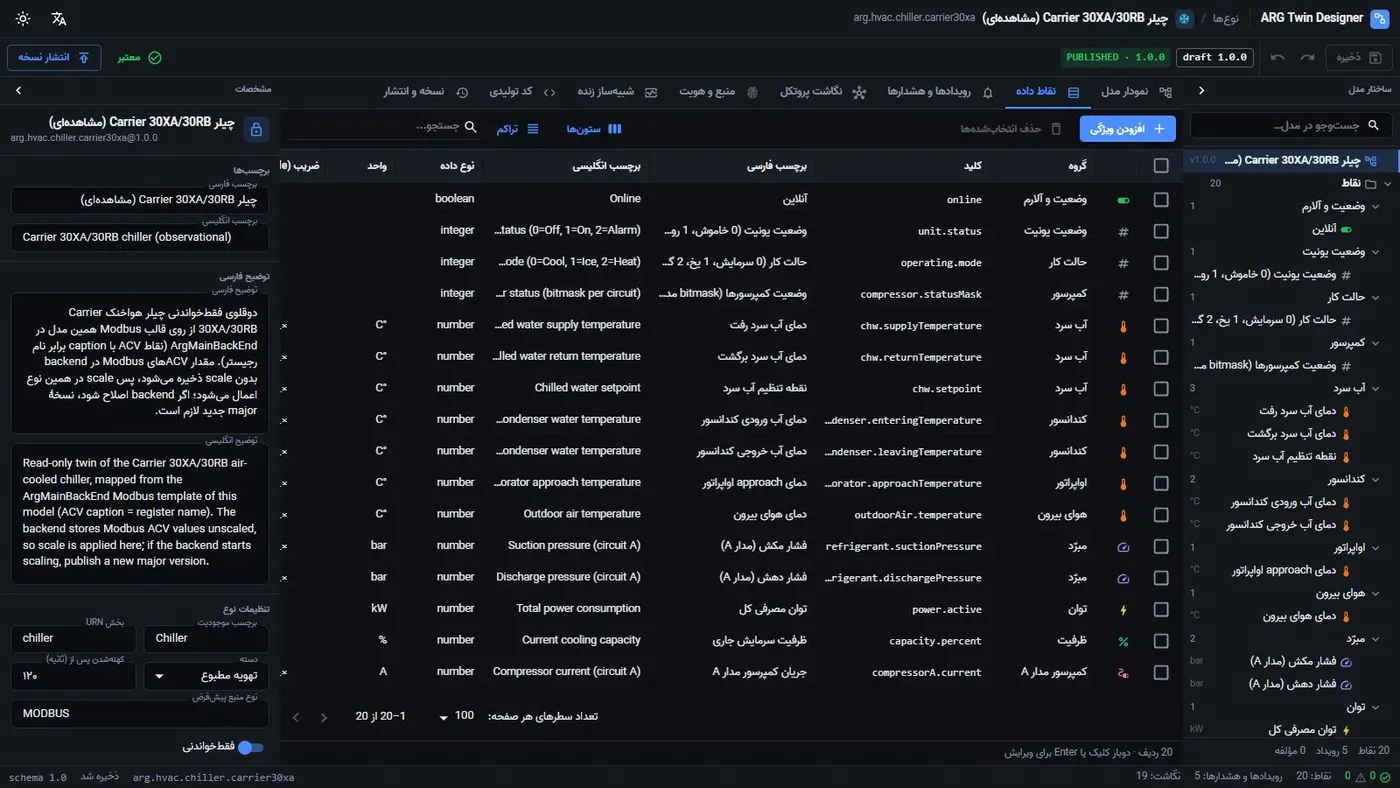
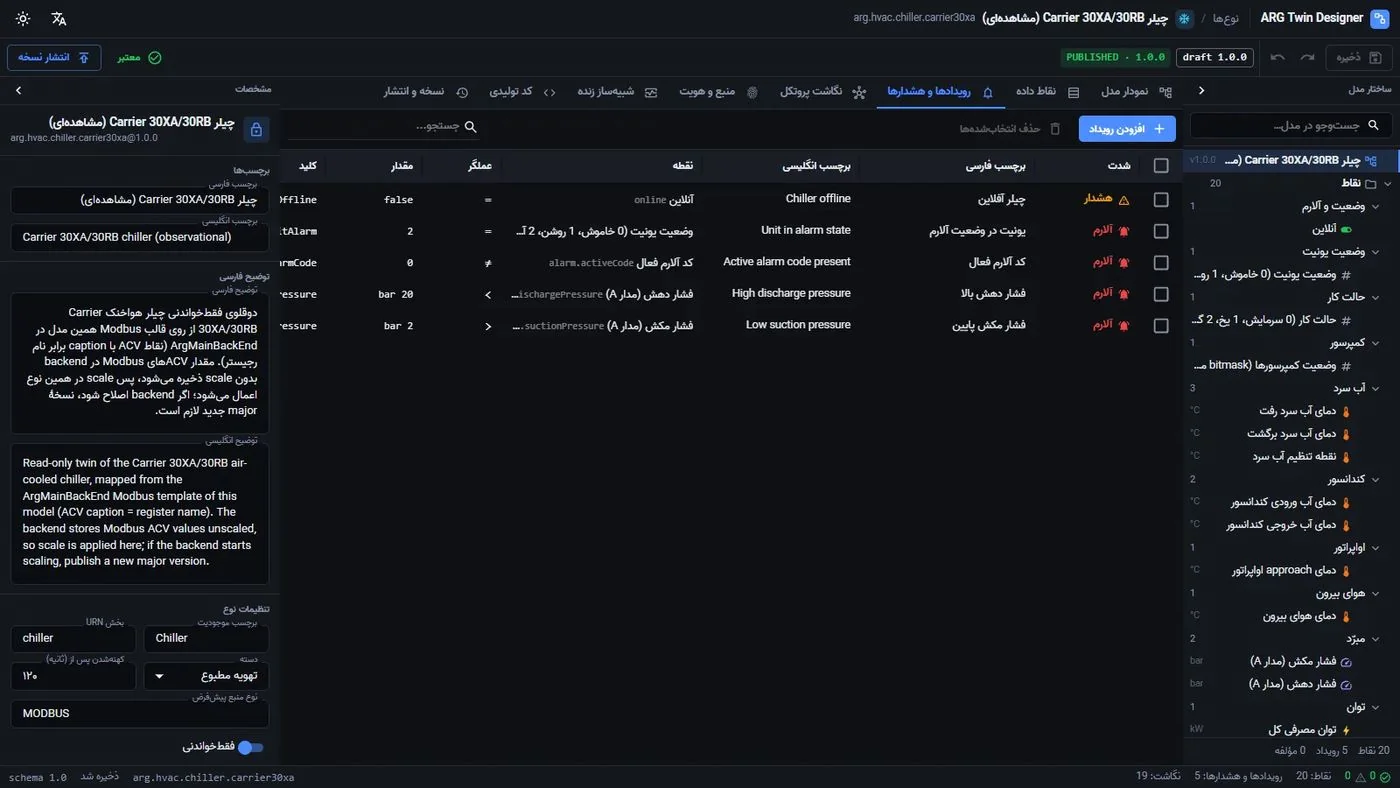
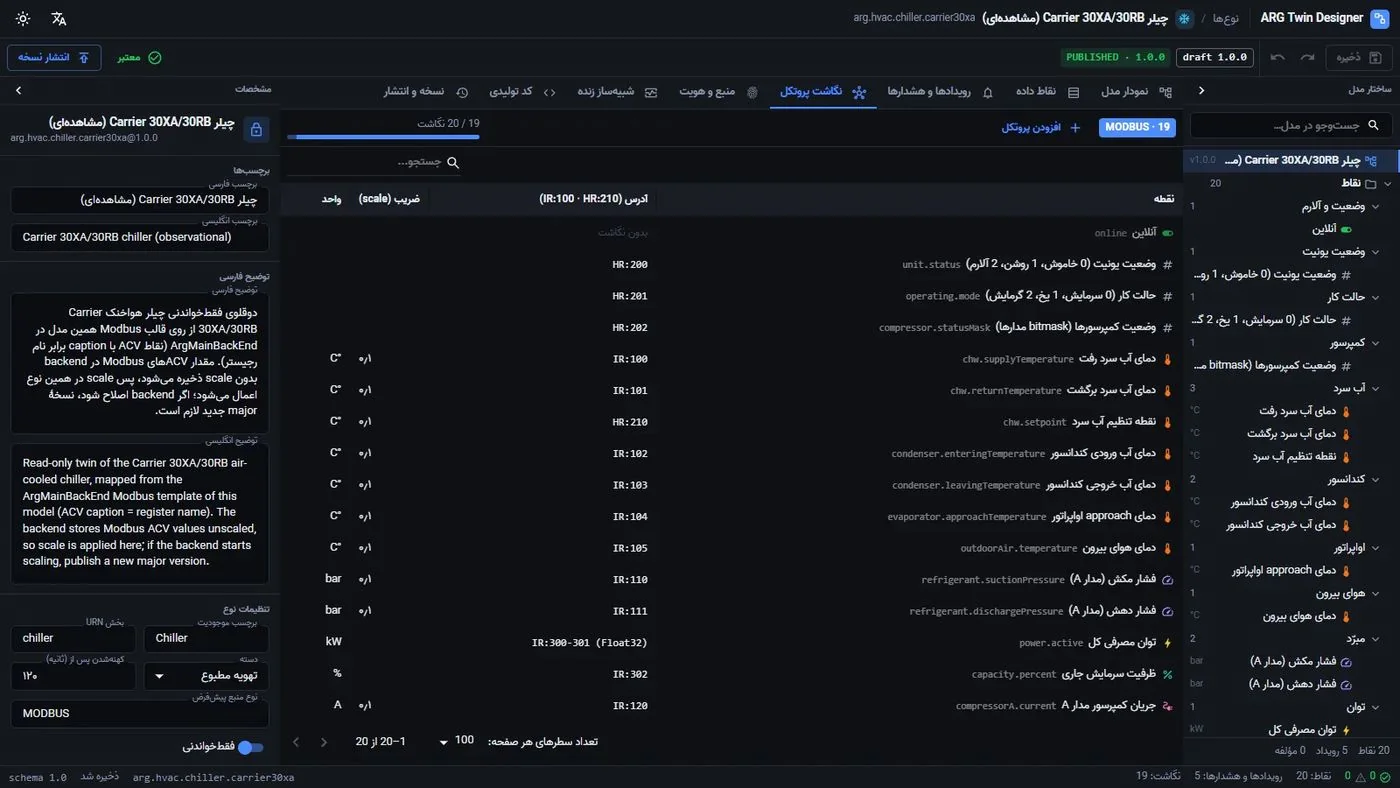
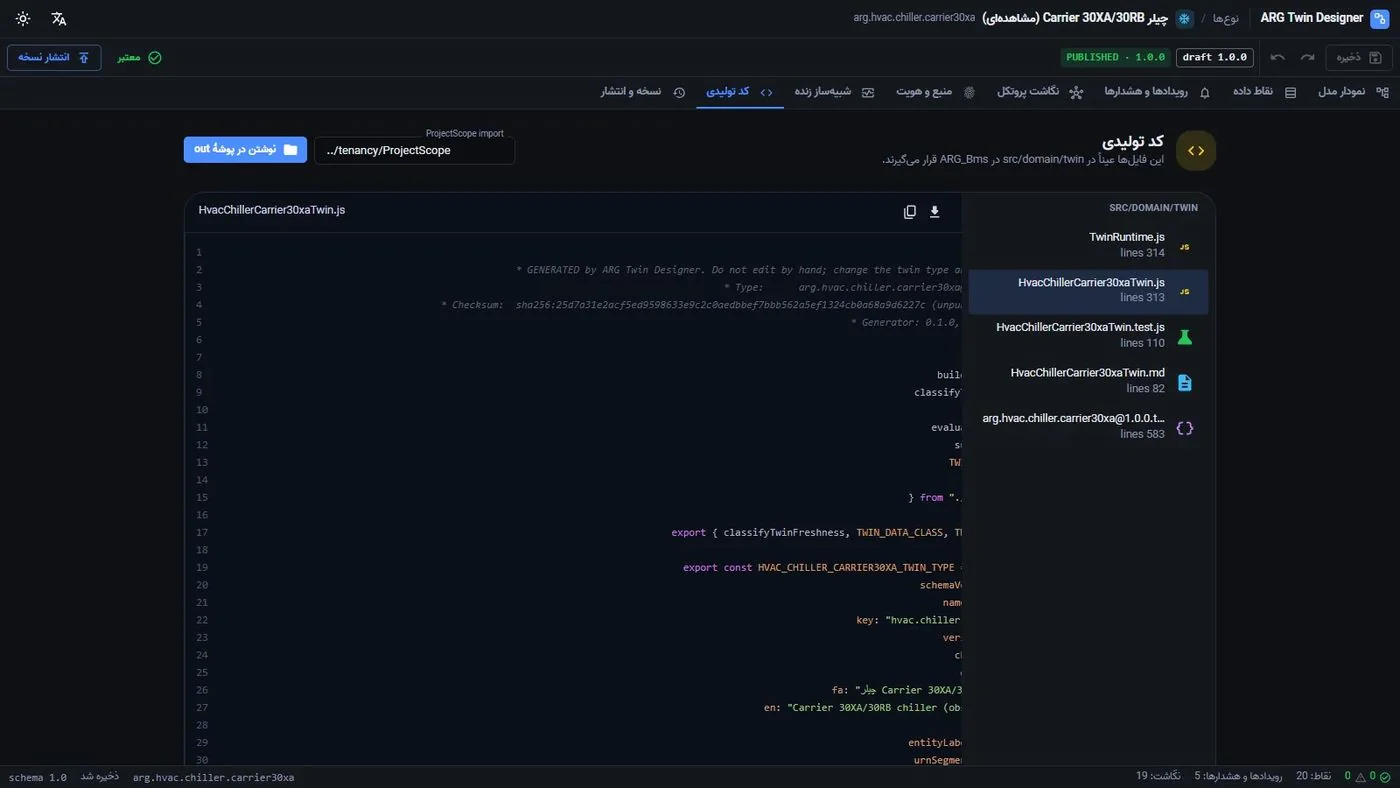
For complex equipment (chiller, pump, AHU, UPS), a “twin type” is defined once as data — properties, components, events, commands and protocol mapping — and from it, executable code, tests and bilingual documentation are generated automatically. Each version is immutable, and version compatibility is checked automatically.

Type Lifecycle
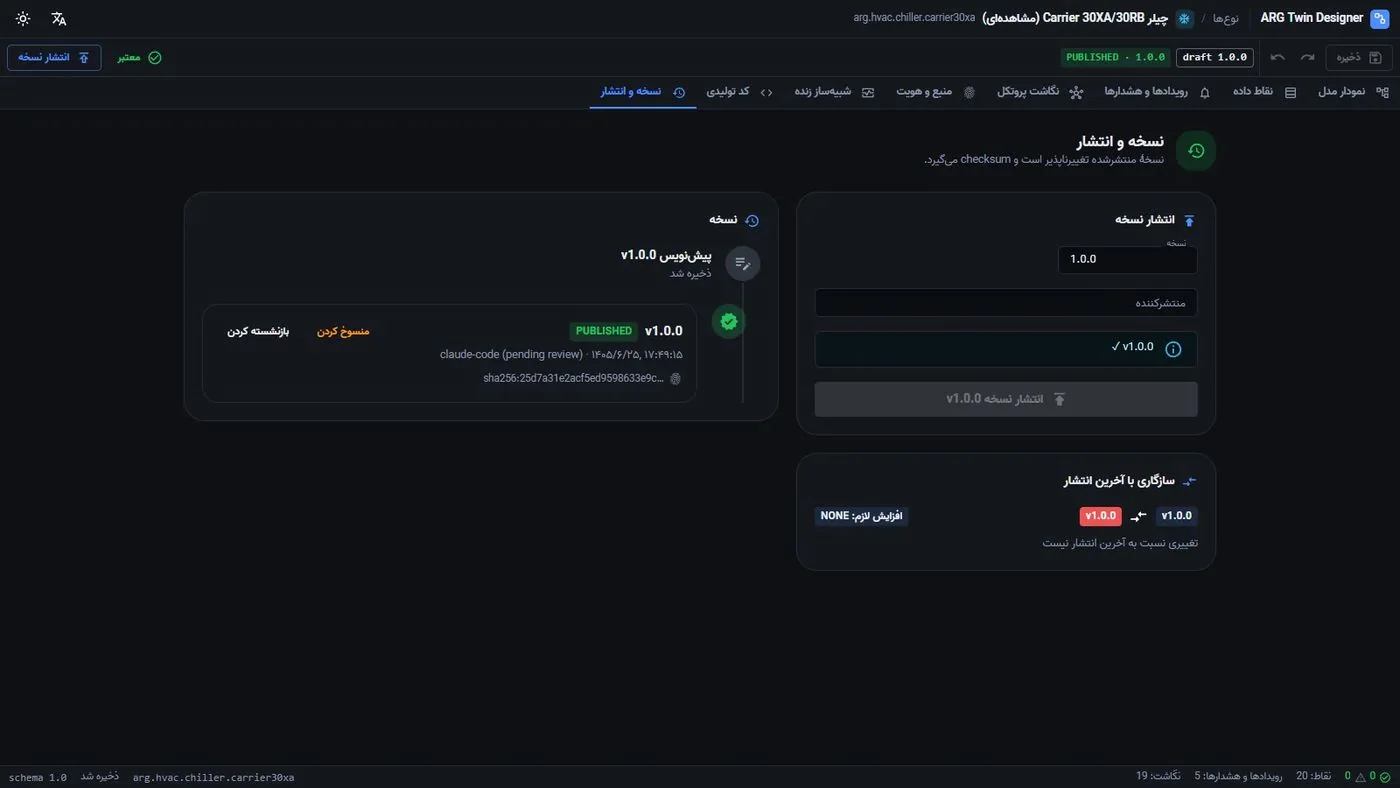
Draft (editing, validation, compatibility check) → Published (immutable, semantic versioning, checksum) → Deprecated (usage warning) → Retired. A draft of the next version is created from a published version.
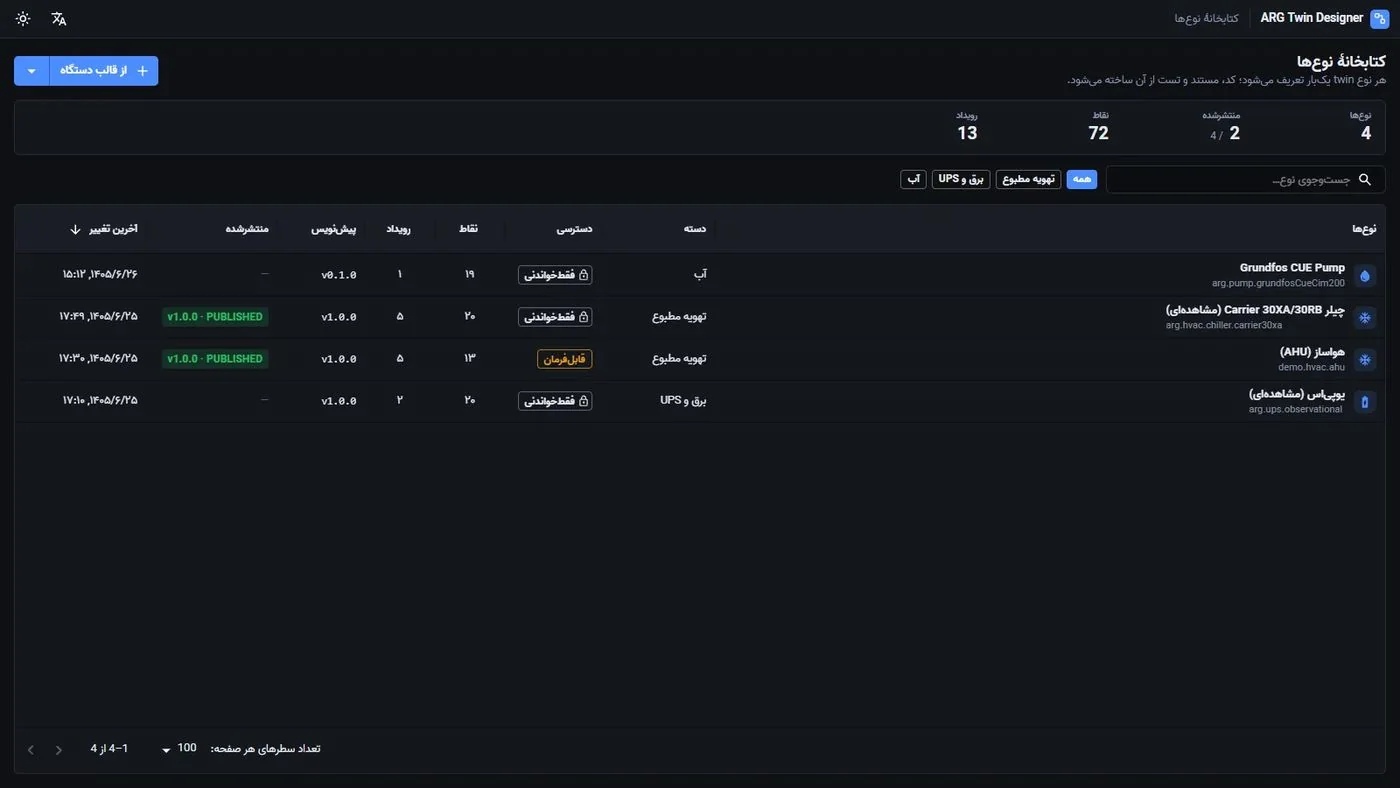
Twin Designer
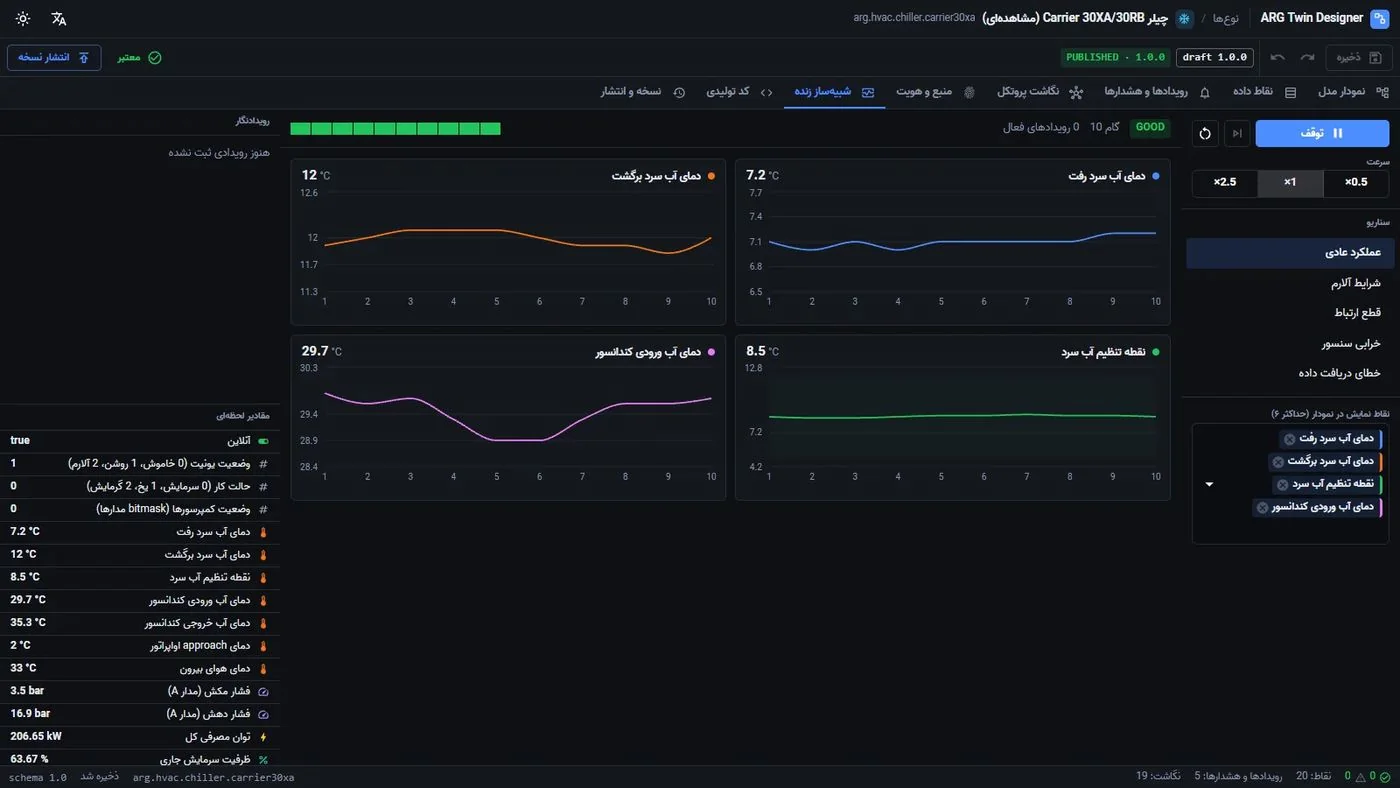
A standalone tool with a Persian-language interface: a type library, a data-model editor with scale preview, event rules expressed as sentences, a protocol-mapping coverage bar (Modbus/BACnet/SNMP/MQTT), ready-made Modbus templates, and a live simulator running the same engine used in the product. An API and command-line interface for validation, publishing and code generation.
Existing types: observational UPS (in the product), Carrier 30XA chiller and AHU (published), Grundfos CUE/CIM 200 pump (draft). The simulator runs exactly the same generated code; the behavior you see at design time is the same behavior as in the product.
2D Dashboard Element Reference
| Element | Specific Settings | Example Use |
|---|---|---|
| Panel | Background (color/image), border, corner radius, shadow, title | Grouping sections of a panel |
| Text | Font, size, color, alignment, dynamic text from a point | Titles, labels |
| Value | Point, unit, precision, label font, color based on status/range, prefix/suffix | Rack temperature, UPS voltage |
| Button | Type (latching/momentary with pulse duration), value to send, confirmation, state colors | Fan on/off, reset |
| Image | Media, fit, opacity, image change based on value | Logo, floor plan, status icon |
| Chart | Multiple points, time window from 1 minute to 7 days, max points, grid, line/area type | Temperature trend, load |
| Gauge / professional gauge | Min/max, color bands, style (needle, arc), unit | Pressure, load percentage |
| Switch / slider / volume / thermostat | Output point, range, step, label, confirmation | Target temperature, fan speed |
| Web view | Address, refresh, permissions | Equipment manufacturer’s page |
| Camera | Stream address, fit, full screen | Server room camera |
| BMS animation | Category and type (153), mapping value to color/speed/level/opacity, label (9 positions) | Rotating pump, tank level |
| Photorealistic equipment | Equipment type (144), states, Persian label | Chiller, transformer, panel |
| 3D object / embedded scene | Saved scene, initial camera, interaction | 3D view inside a 2D panel |
| Dashboard link | Target dashboard, appearance | Navigating between floors |
| Clock / weather | Format, time zone / city | Video wall |
| Advanced list | Columns, sources (points/devices), sorting, dedicated designer | Rack table |
| Device monitor | Category filter, pagination, point history | Device cards for a space |
3D Library Categories
Refinery and petrochemical · Fuel station · Basic shapes · Building and architecture · HVAC · Pumps · Tanks · Electrical and power · Sensors · Fire safety and suppression · Switches and controls · DCIM / server room · Access and security · Roads and infrastructure · Miscellaneous equipment · Wiring and conduit · Flow and arrows · Airport · Hospital · Equipment · … (29 categories, 167 items, 92 object templates). Data-bindable properties: color, light intensity, rotation, scale, fill level, visibility, label text.
See the Digital Twin live
The live ArgBMS demo with real 3D twins, dashboards and logic.