ML
Learn patterns and predict
- Input
- Consumption, sensor and equipment history
A model is trained on equipment data, then analyses future trends or unusual behaviour.
- Output
- Consumption forecasts, anomaly detection and health indicators
ARG Digital Twin is the live digital counterpart of a physical site: every real device has a digital twin carrying its live value, state, history, limits and behaviour — and every process of an organisation runs in one system behind one sign-in.
AI works in this environment too: a project-connected assistant, RAG knowledge retrieval and an ML backend for training, prediction and model evaluation.
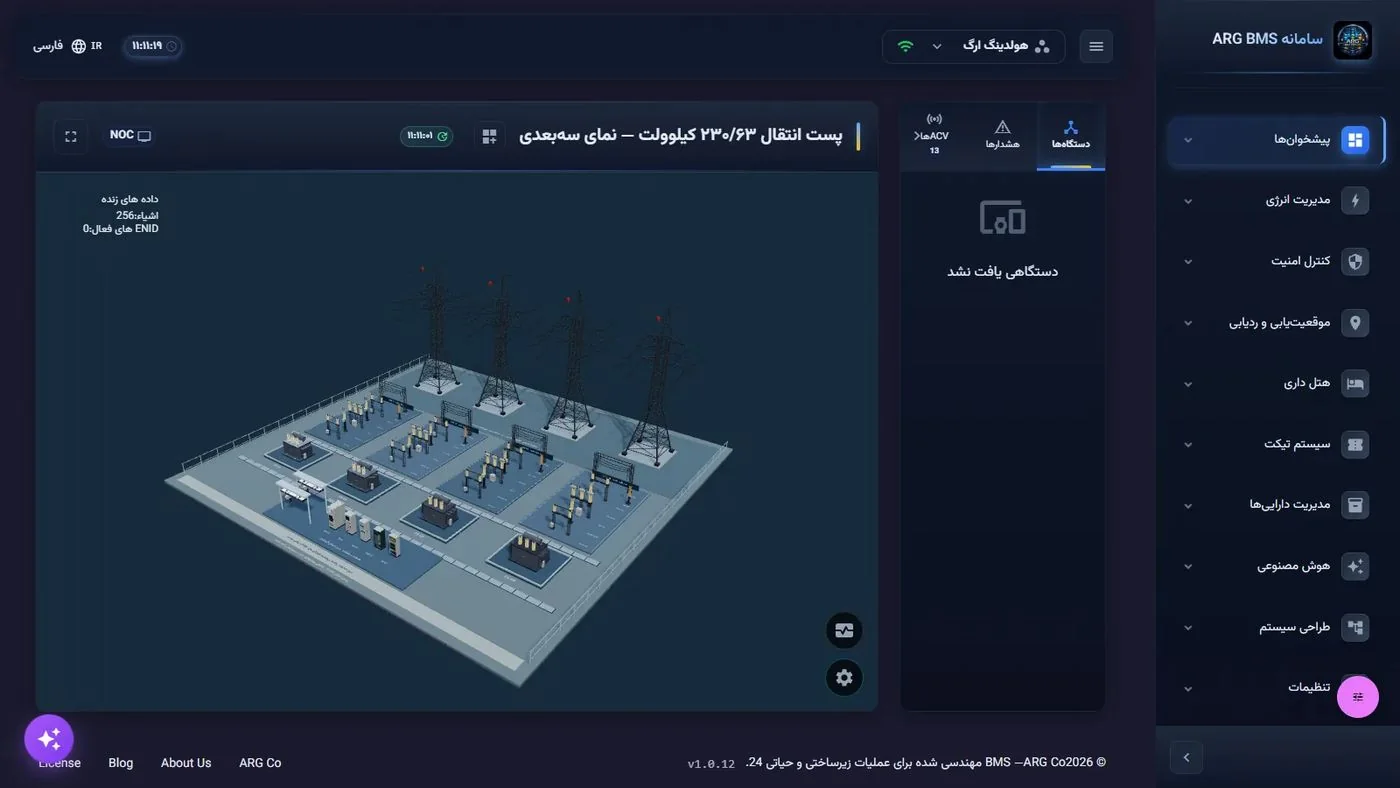
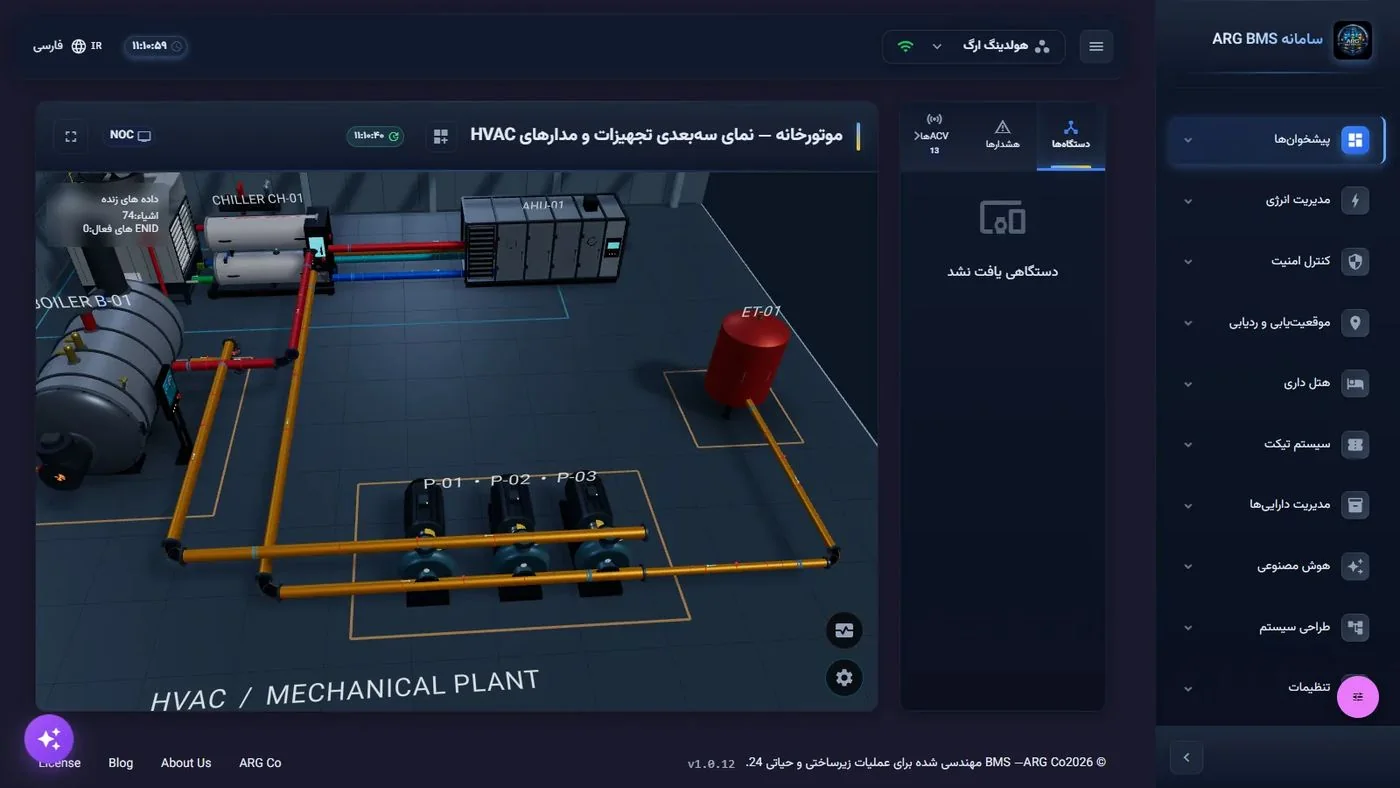
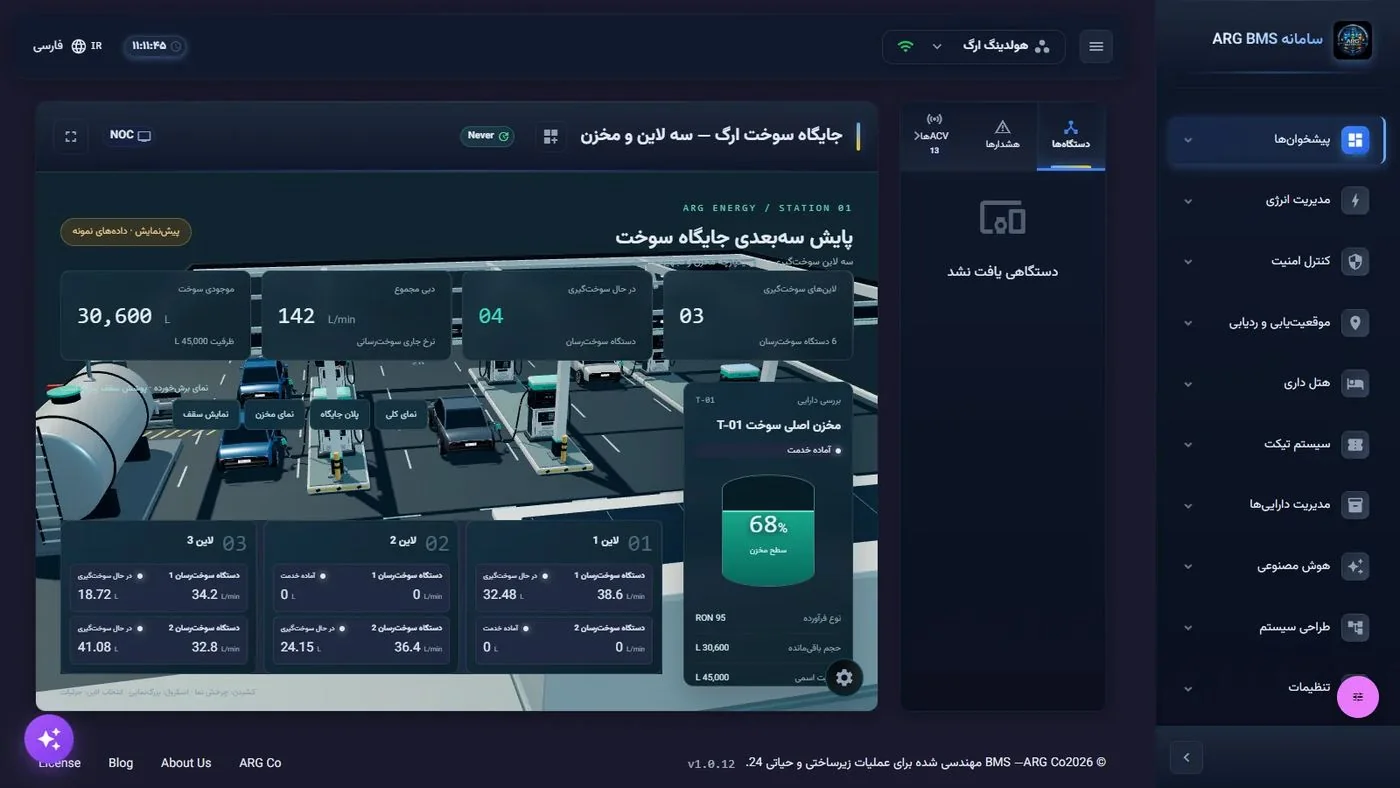
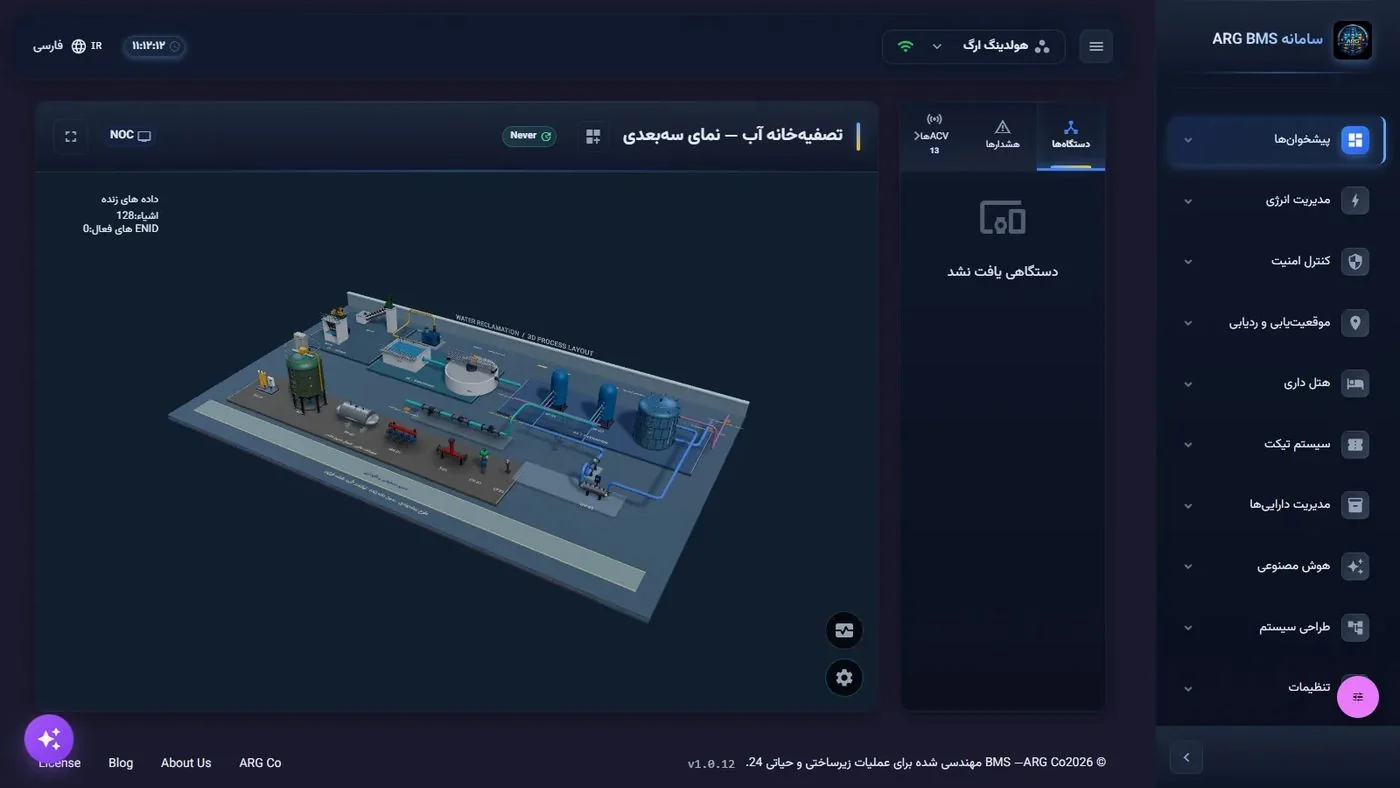
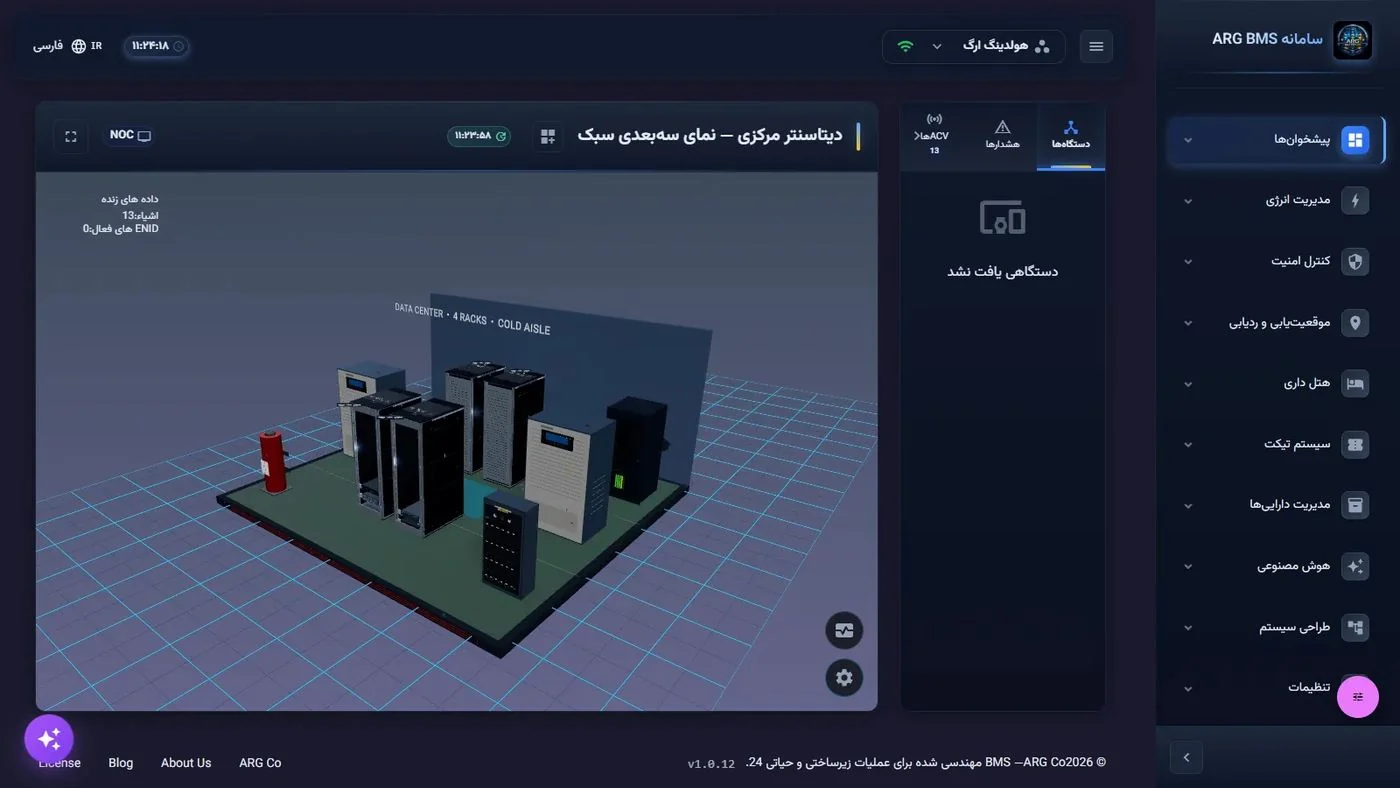
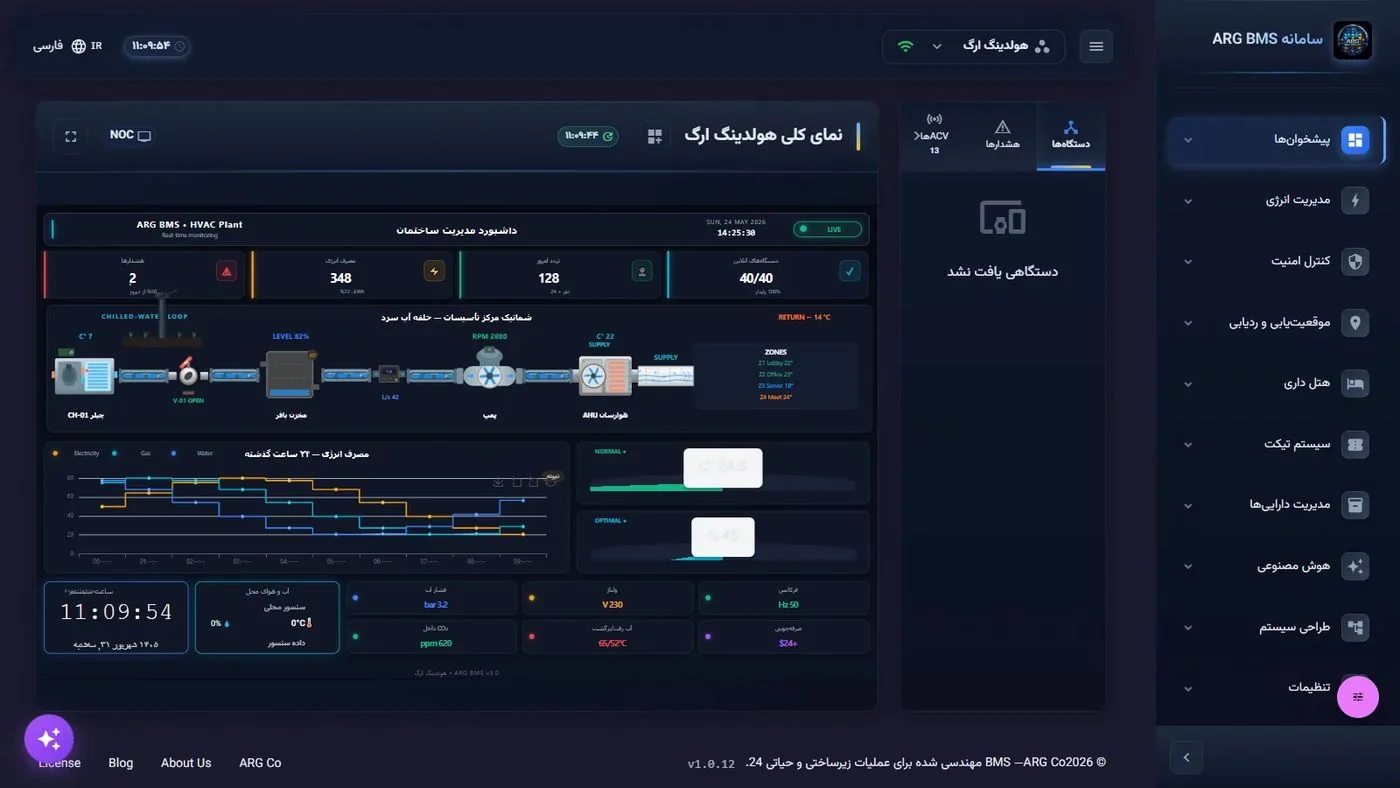
230/63 kV substation — live 3D twin
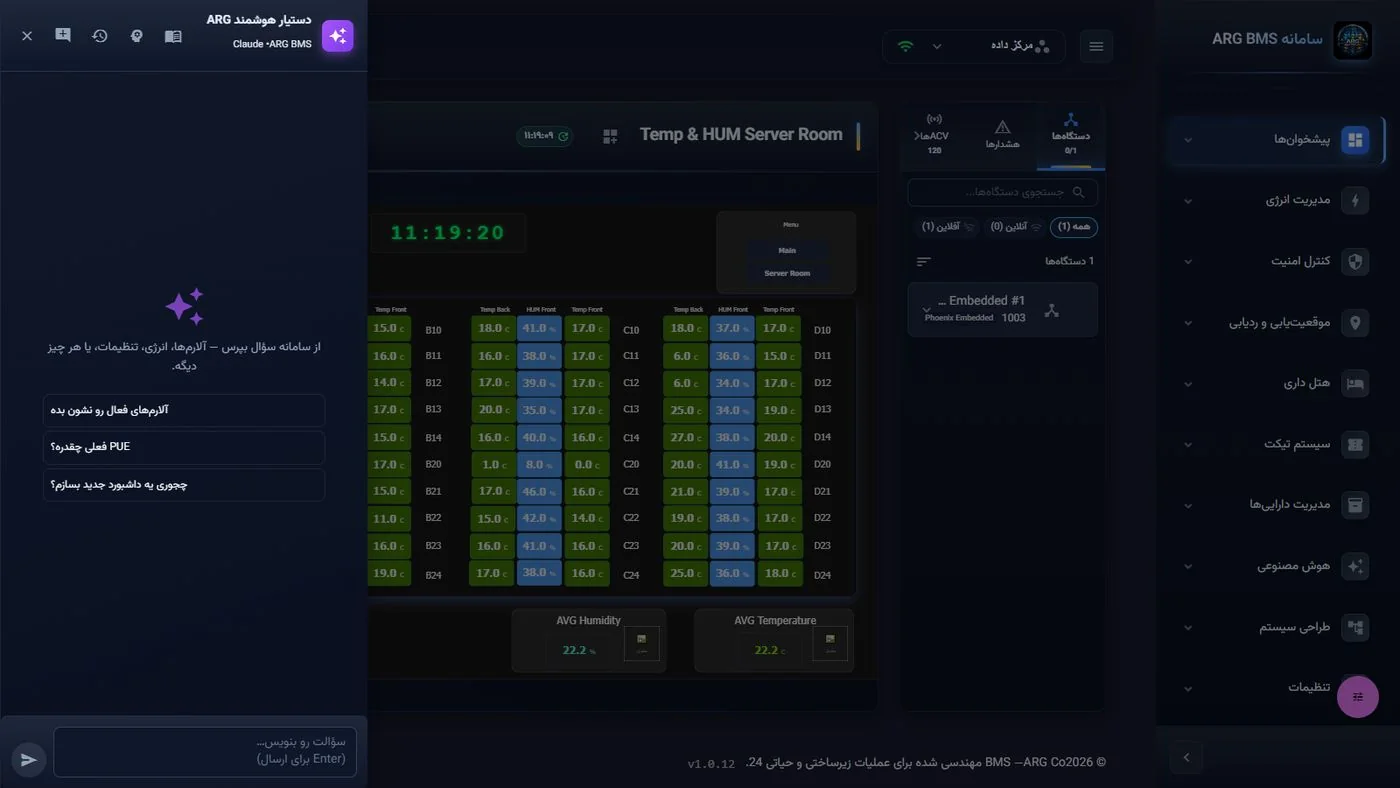
The project-connected assistant and the independent ARG_AI backend serve complementary roles: one helps users understand the situation and work inside the software; the other provides model training, analysis, prediction and result monitoring.
Prepare history → train models → predict and detect → evaluate and monitor
User intent → relevant knowledge and project tools → analysis or proposed change → user confirmation
A model is trained on equipment data, then analyses future trends or unusual behaviour.
Knowledge retrieval finds passages relevant to the question and equipment and supplies them to the assistant.
The assistant explains findings, summarises information and uses system tools to investigate the question.
Tools read equipment state, alarms and history; proposed creation or changes enter the user confirmation workflow.
RAG supplies relevant knowledge, the LLM interprets the request and results, and agent tools move the work forward inside the system.
The assistant draws on device catalogs, SNMP and Modbus templates, OIDs and uploaded project documents. RAG combines keyword and semantic retrieval to answer in the context of the relevant equipment.
A user request can become a proposal for buildings, floors, spaces, devices and points, or for dashboard creation and cloning, 2D elements, scenes and 3D objects. System tools and user confirmation carry out the workflow.
The assistant reads and checks existing logic and proposes creating or editing Rules, Limits, Scenarios, Scripts and State Machines. Command-producing logic starts disabled and requires a separate activation confirmation.
Conversation history, summaries and user or project memory help continue the work. Equipment aliases, preferences and routines can be retained, pinned or forgotten.
Ask the assistant to inspect active alarms, offline equipment or a point’s history. The request carries project context and tools read the required information from the system. Proposed changes are presented for user confirmation.
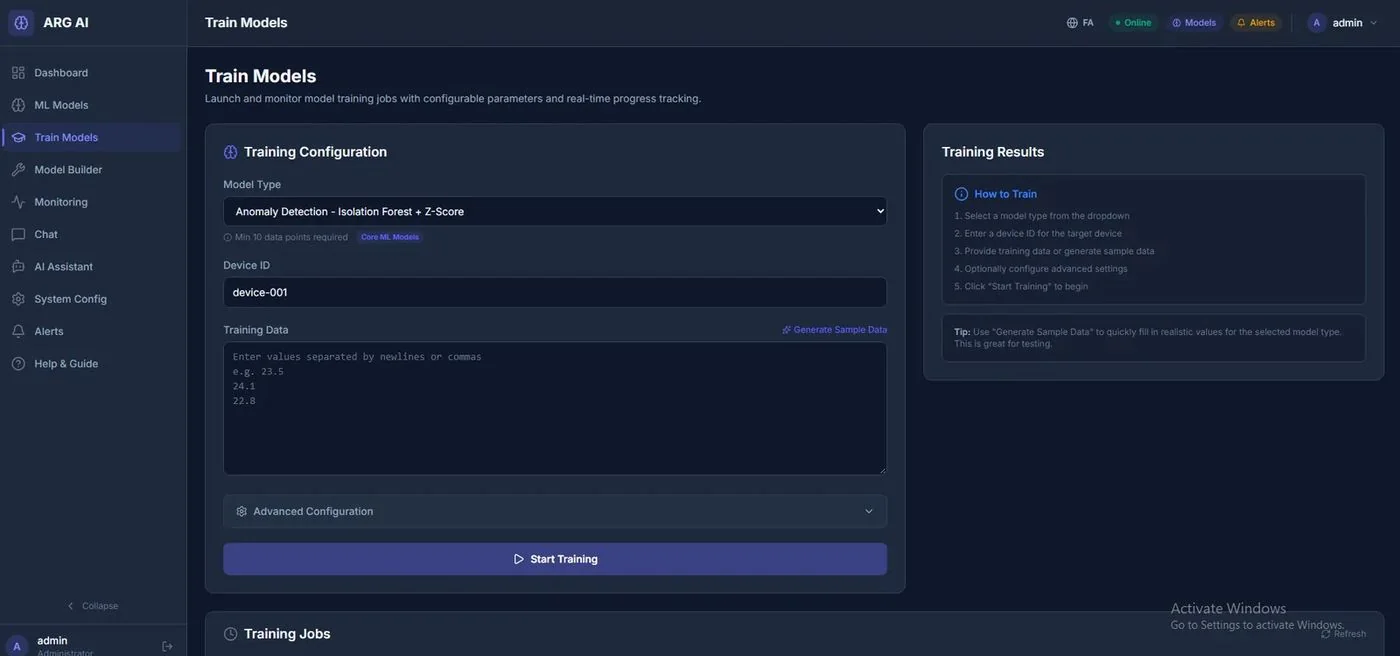
For energy forecasting, historical data trains the model; results are checked against test data and recorded with error metrics. Anomaly detection learns normal behaviour to identify observations that need investigation.
For a refinery, petrochemical plant or other infrastructure, project engineering defines data sources, equipment mapping, history quality, permitted documents and acceptance criteria. The deployment guide describes OT/DMZ integration and local LLM or provider API options. In this industrial architecture, AI informs engineers and operators while process control remains in the existing control system.
Eleven sections, 39 chapters — each with real screens of the software.
3D twins and dashboards built with the platform
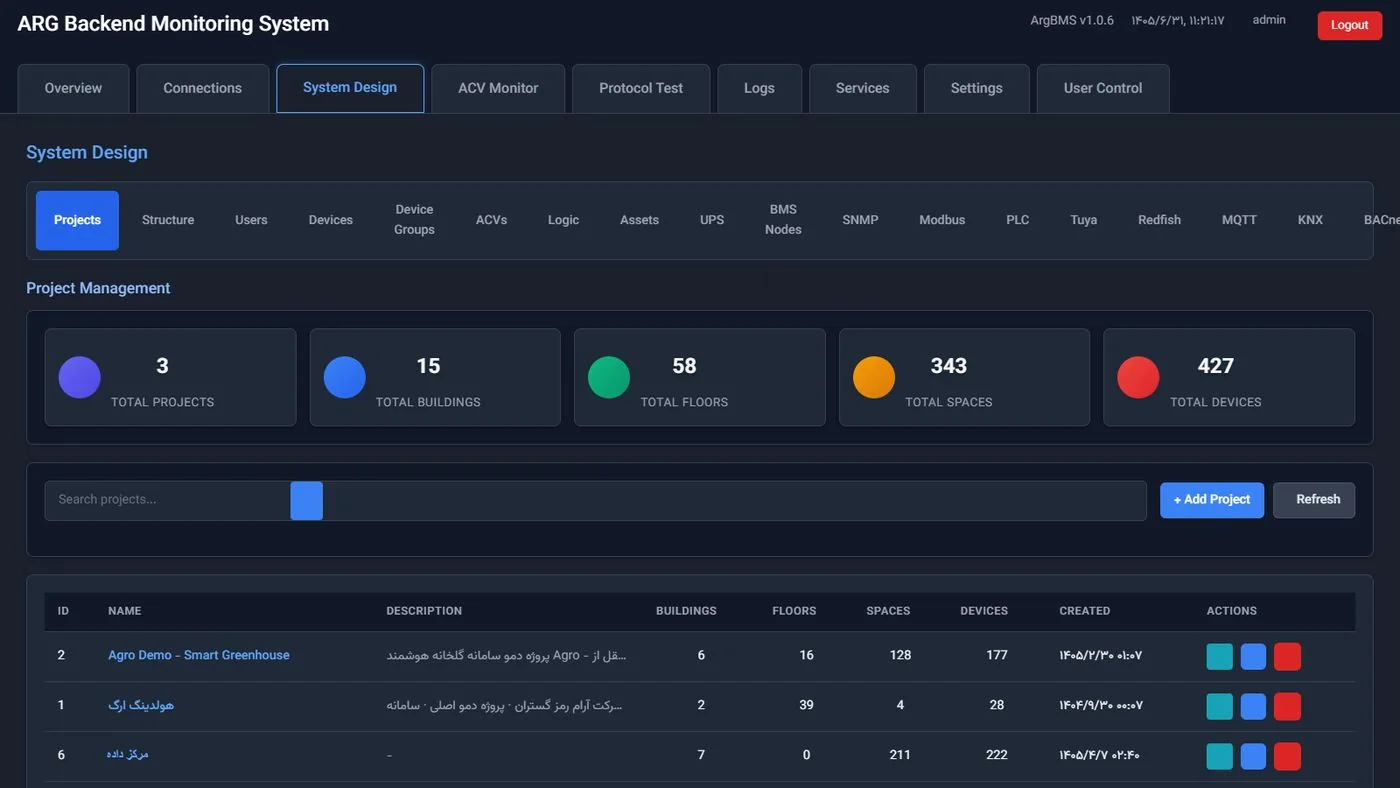
Device-to-dashboard chain, point model, topologies
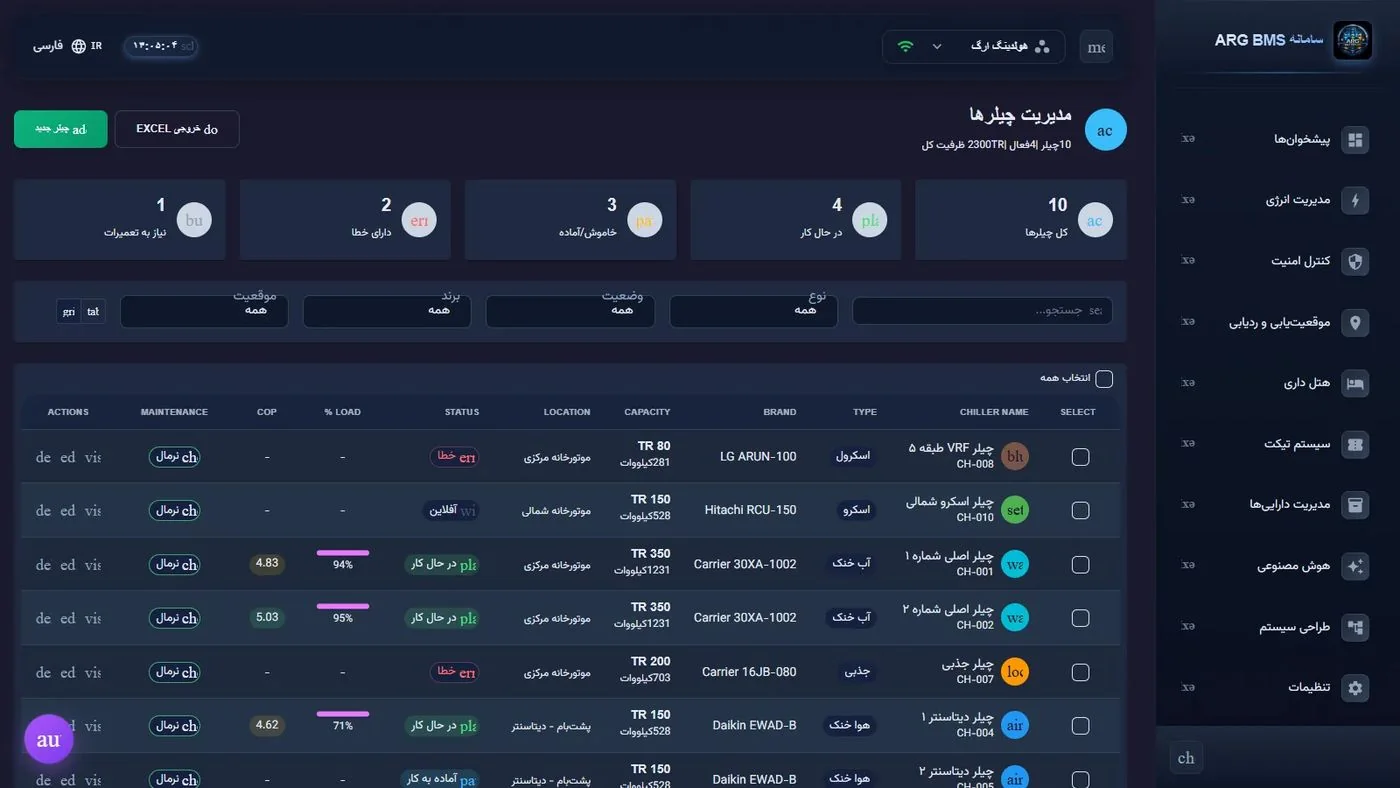
22 menu groups that digitise every mechanism of an organisation
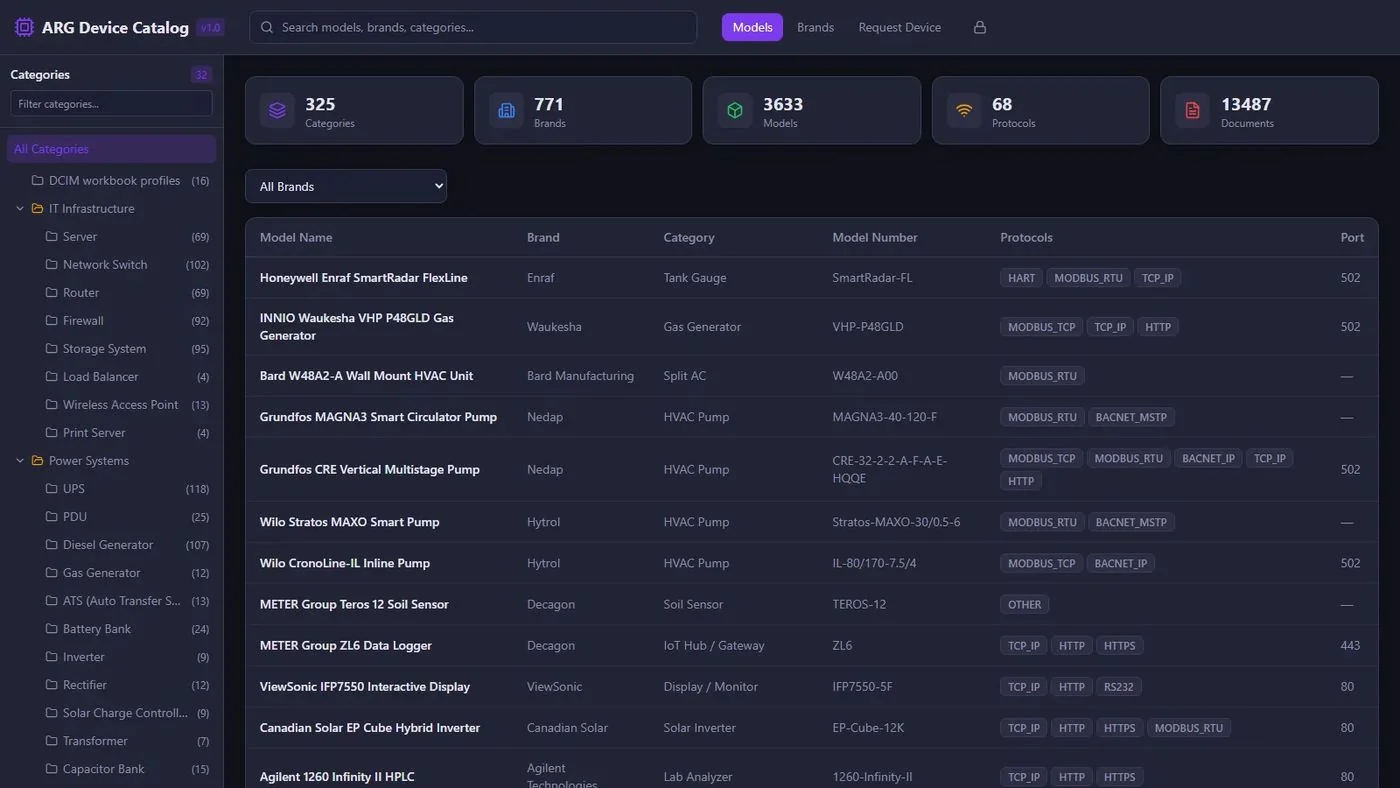
Industrial protocols, the ARG Device Catalog, controllers
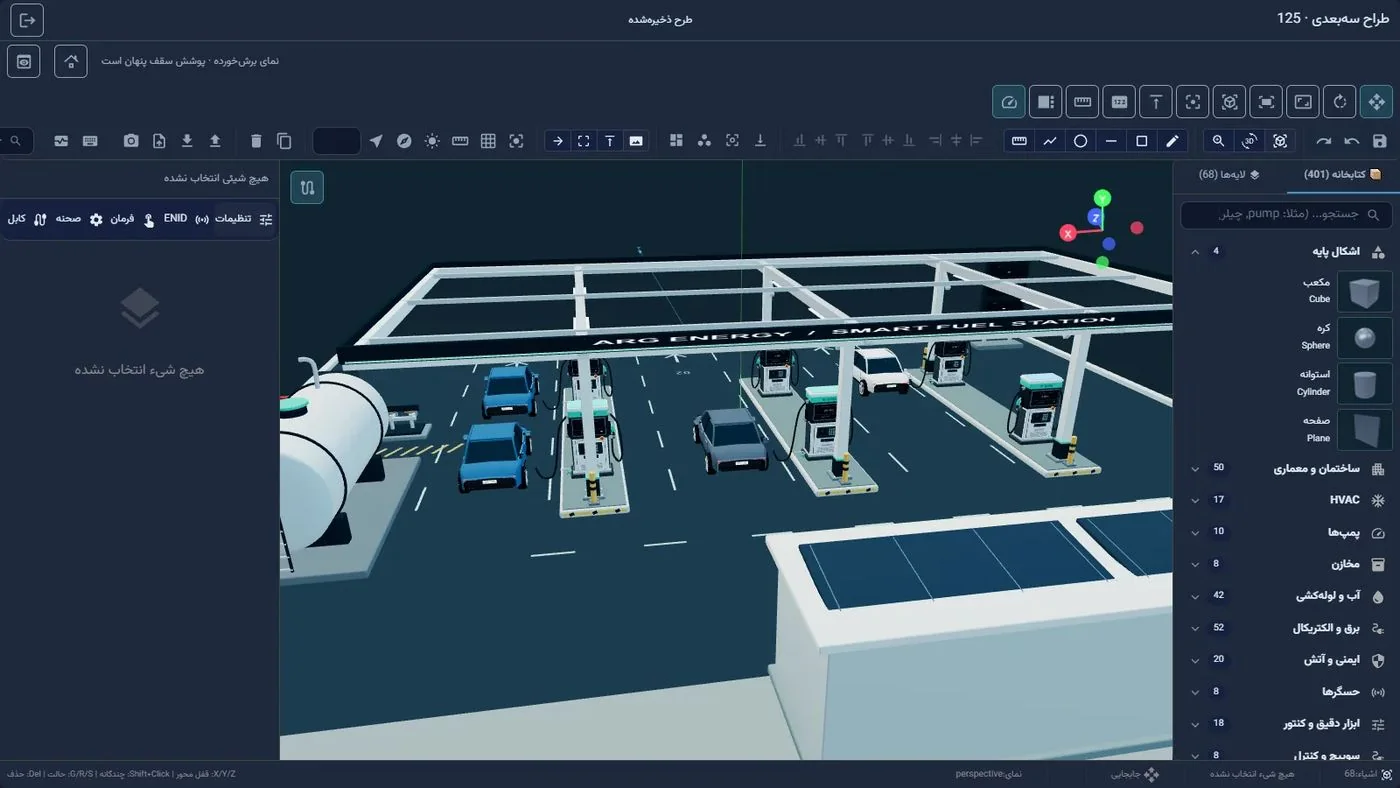
Real-time monitoring, 2D designer, scene builder, Twin Designer
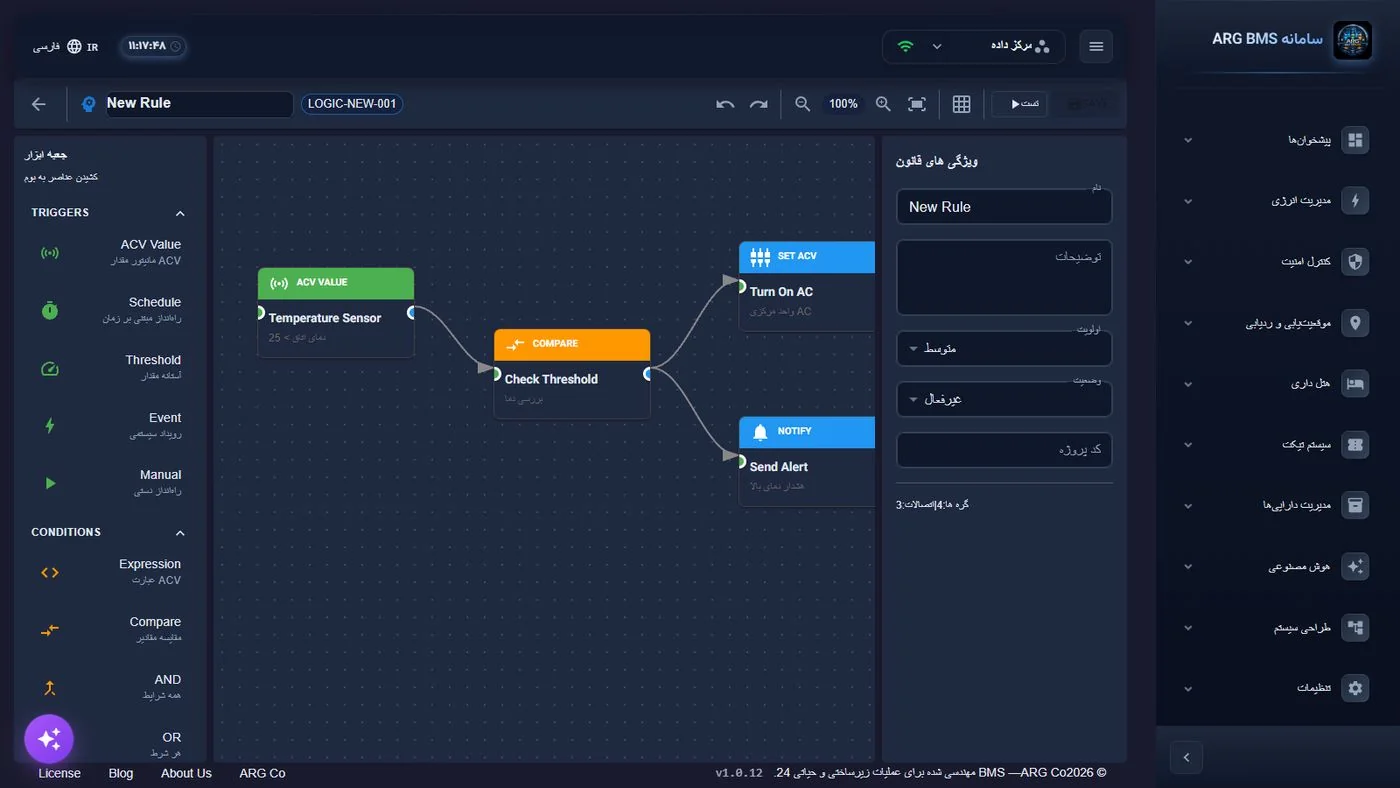
Limits and alarms, logic engine, scenarios, state machines, test lab
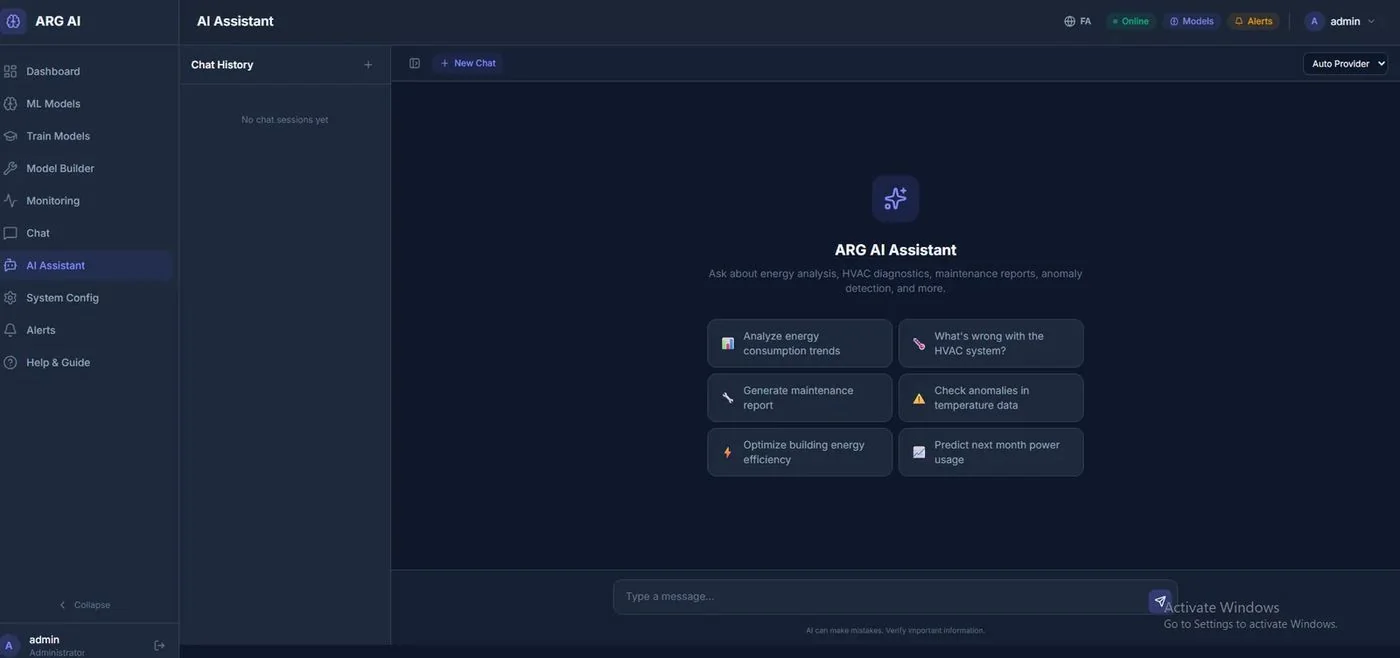
Persian AI assistant, the ARG AI backend, offline map server
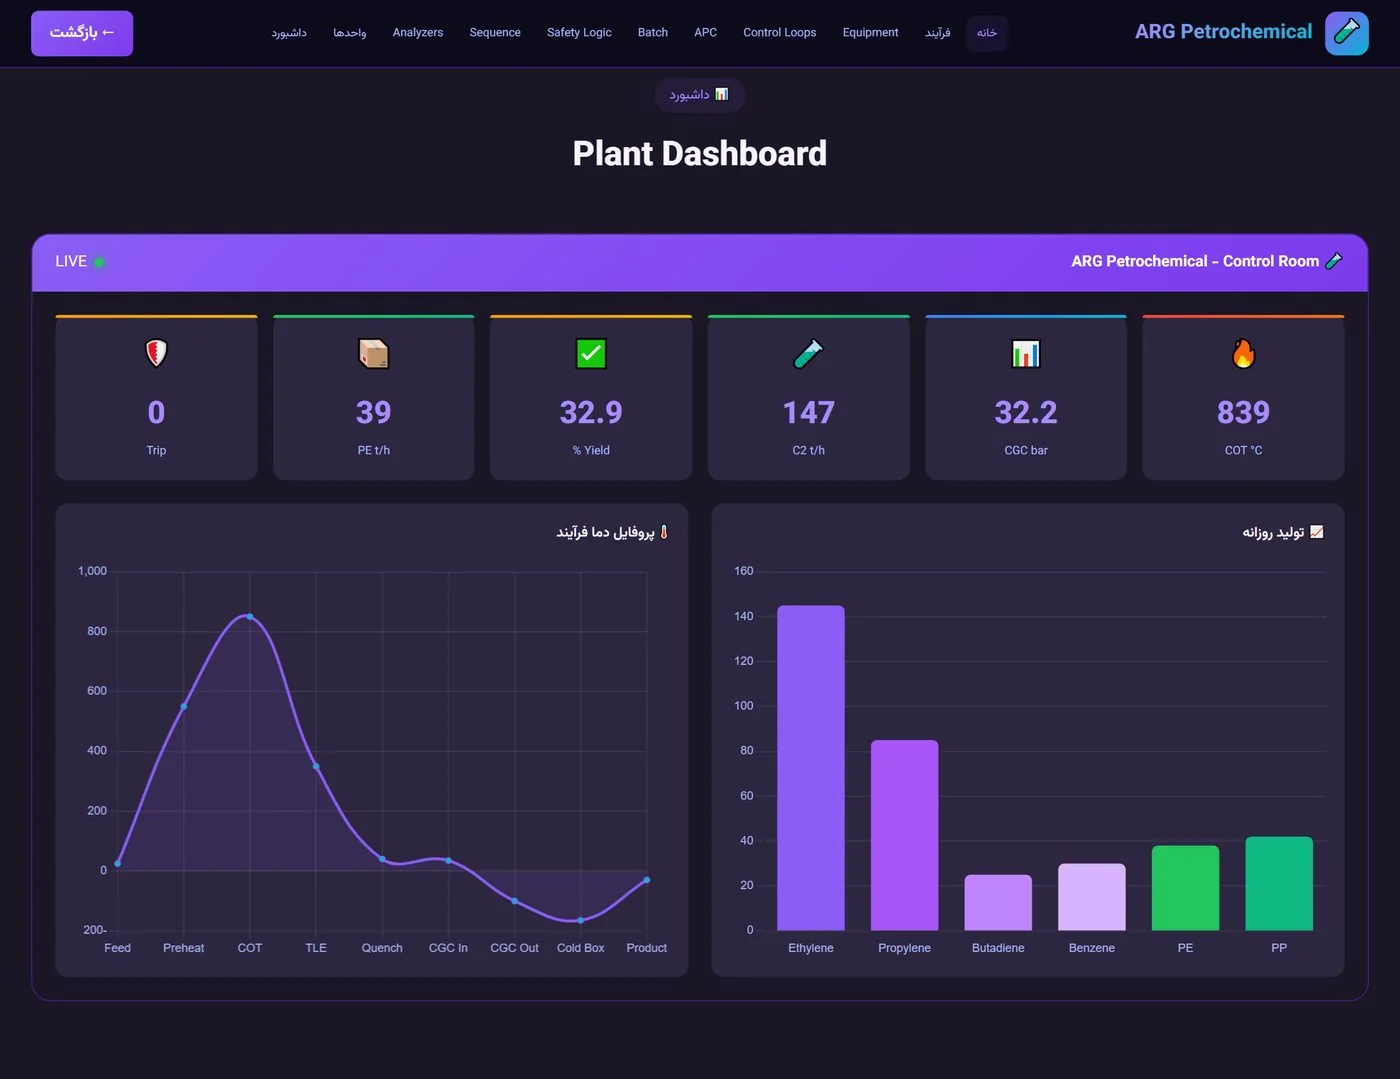
44 industries in 10 sectors, each with its own dashboard
Measured capacity, HA and clustering, roles, layered security
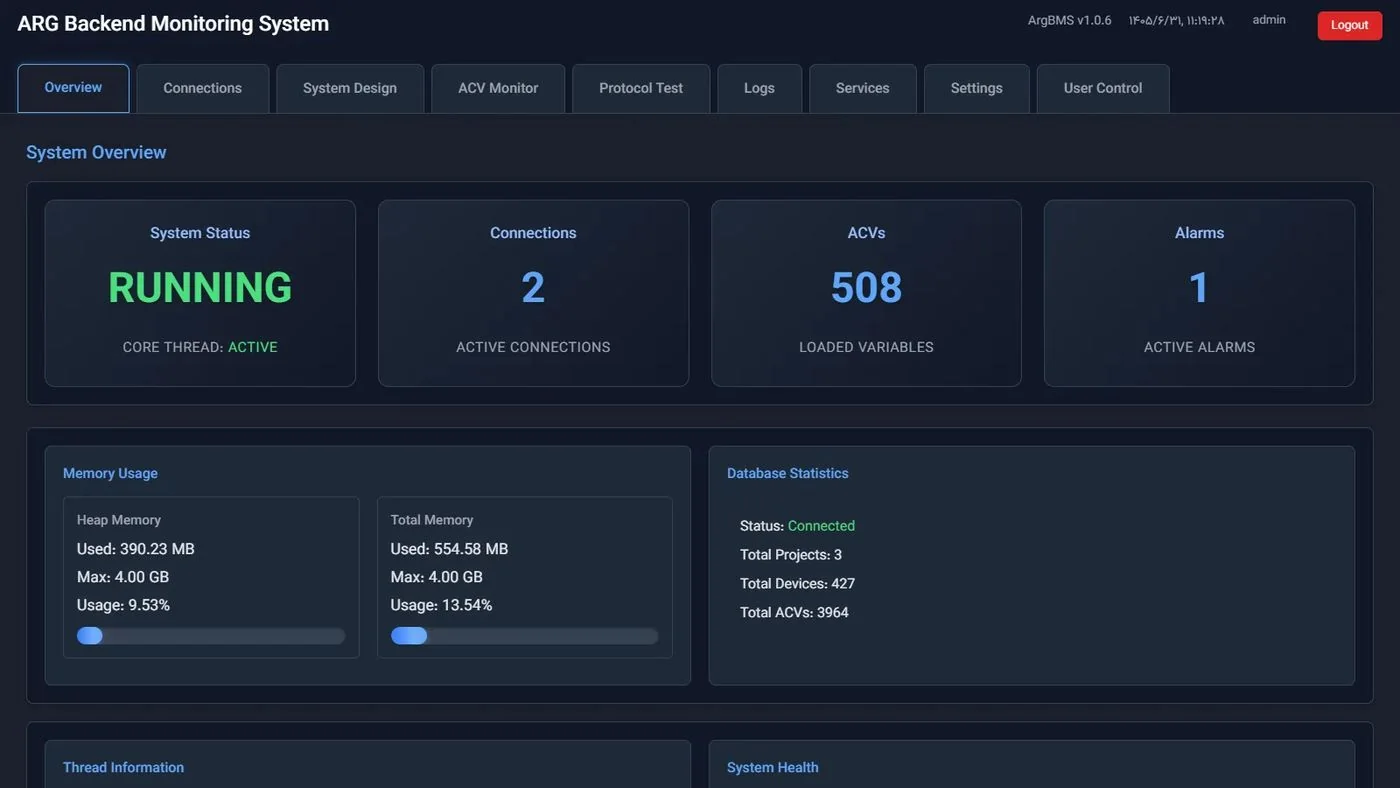
Multi-project, profiles, deployment, method, server console, support
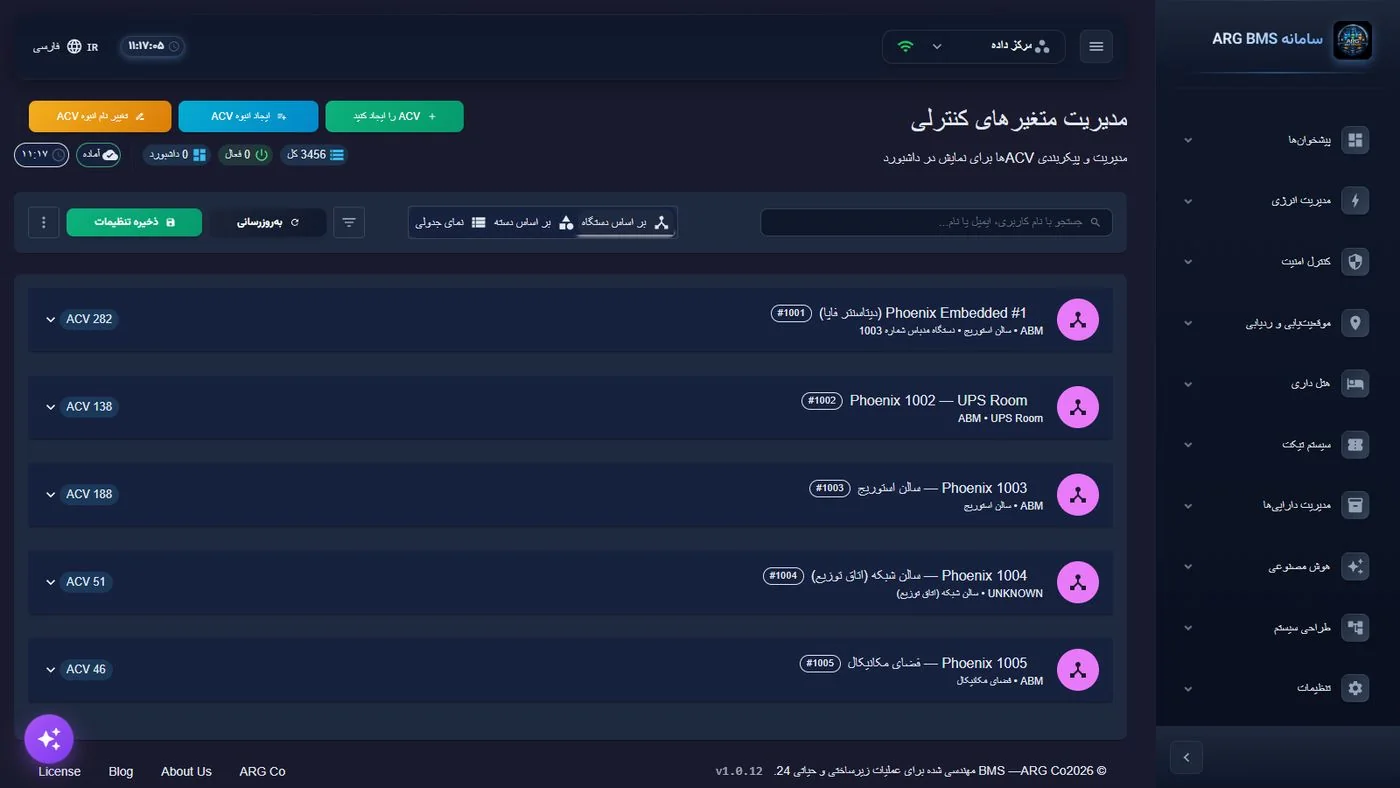
Integration and API, references, data model, how-tos, FAQ, roadmap
Step-by-step courses for operators, engineers, administrators and managers — real screens, live-demo exercises, checks and a certificate.
A look at every component: from field devices and protocols at the bottom, up through the platform core, companion services, the presentation layer and users at the top. Each layer is described in detail, with a diagram, in its own chapter.
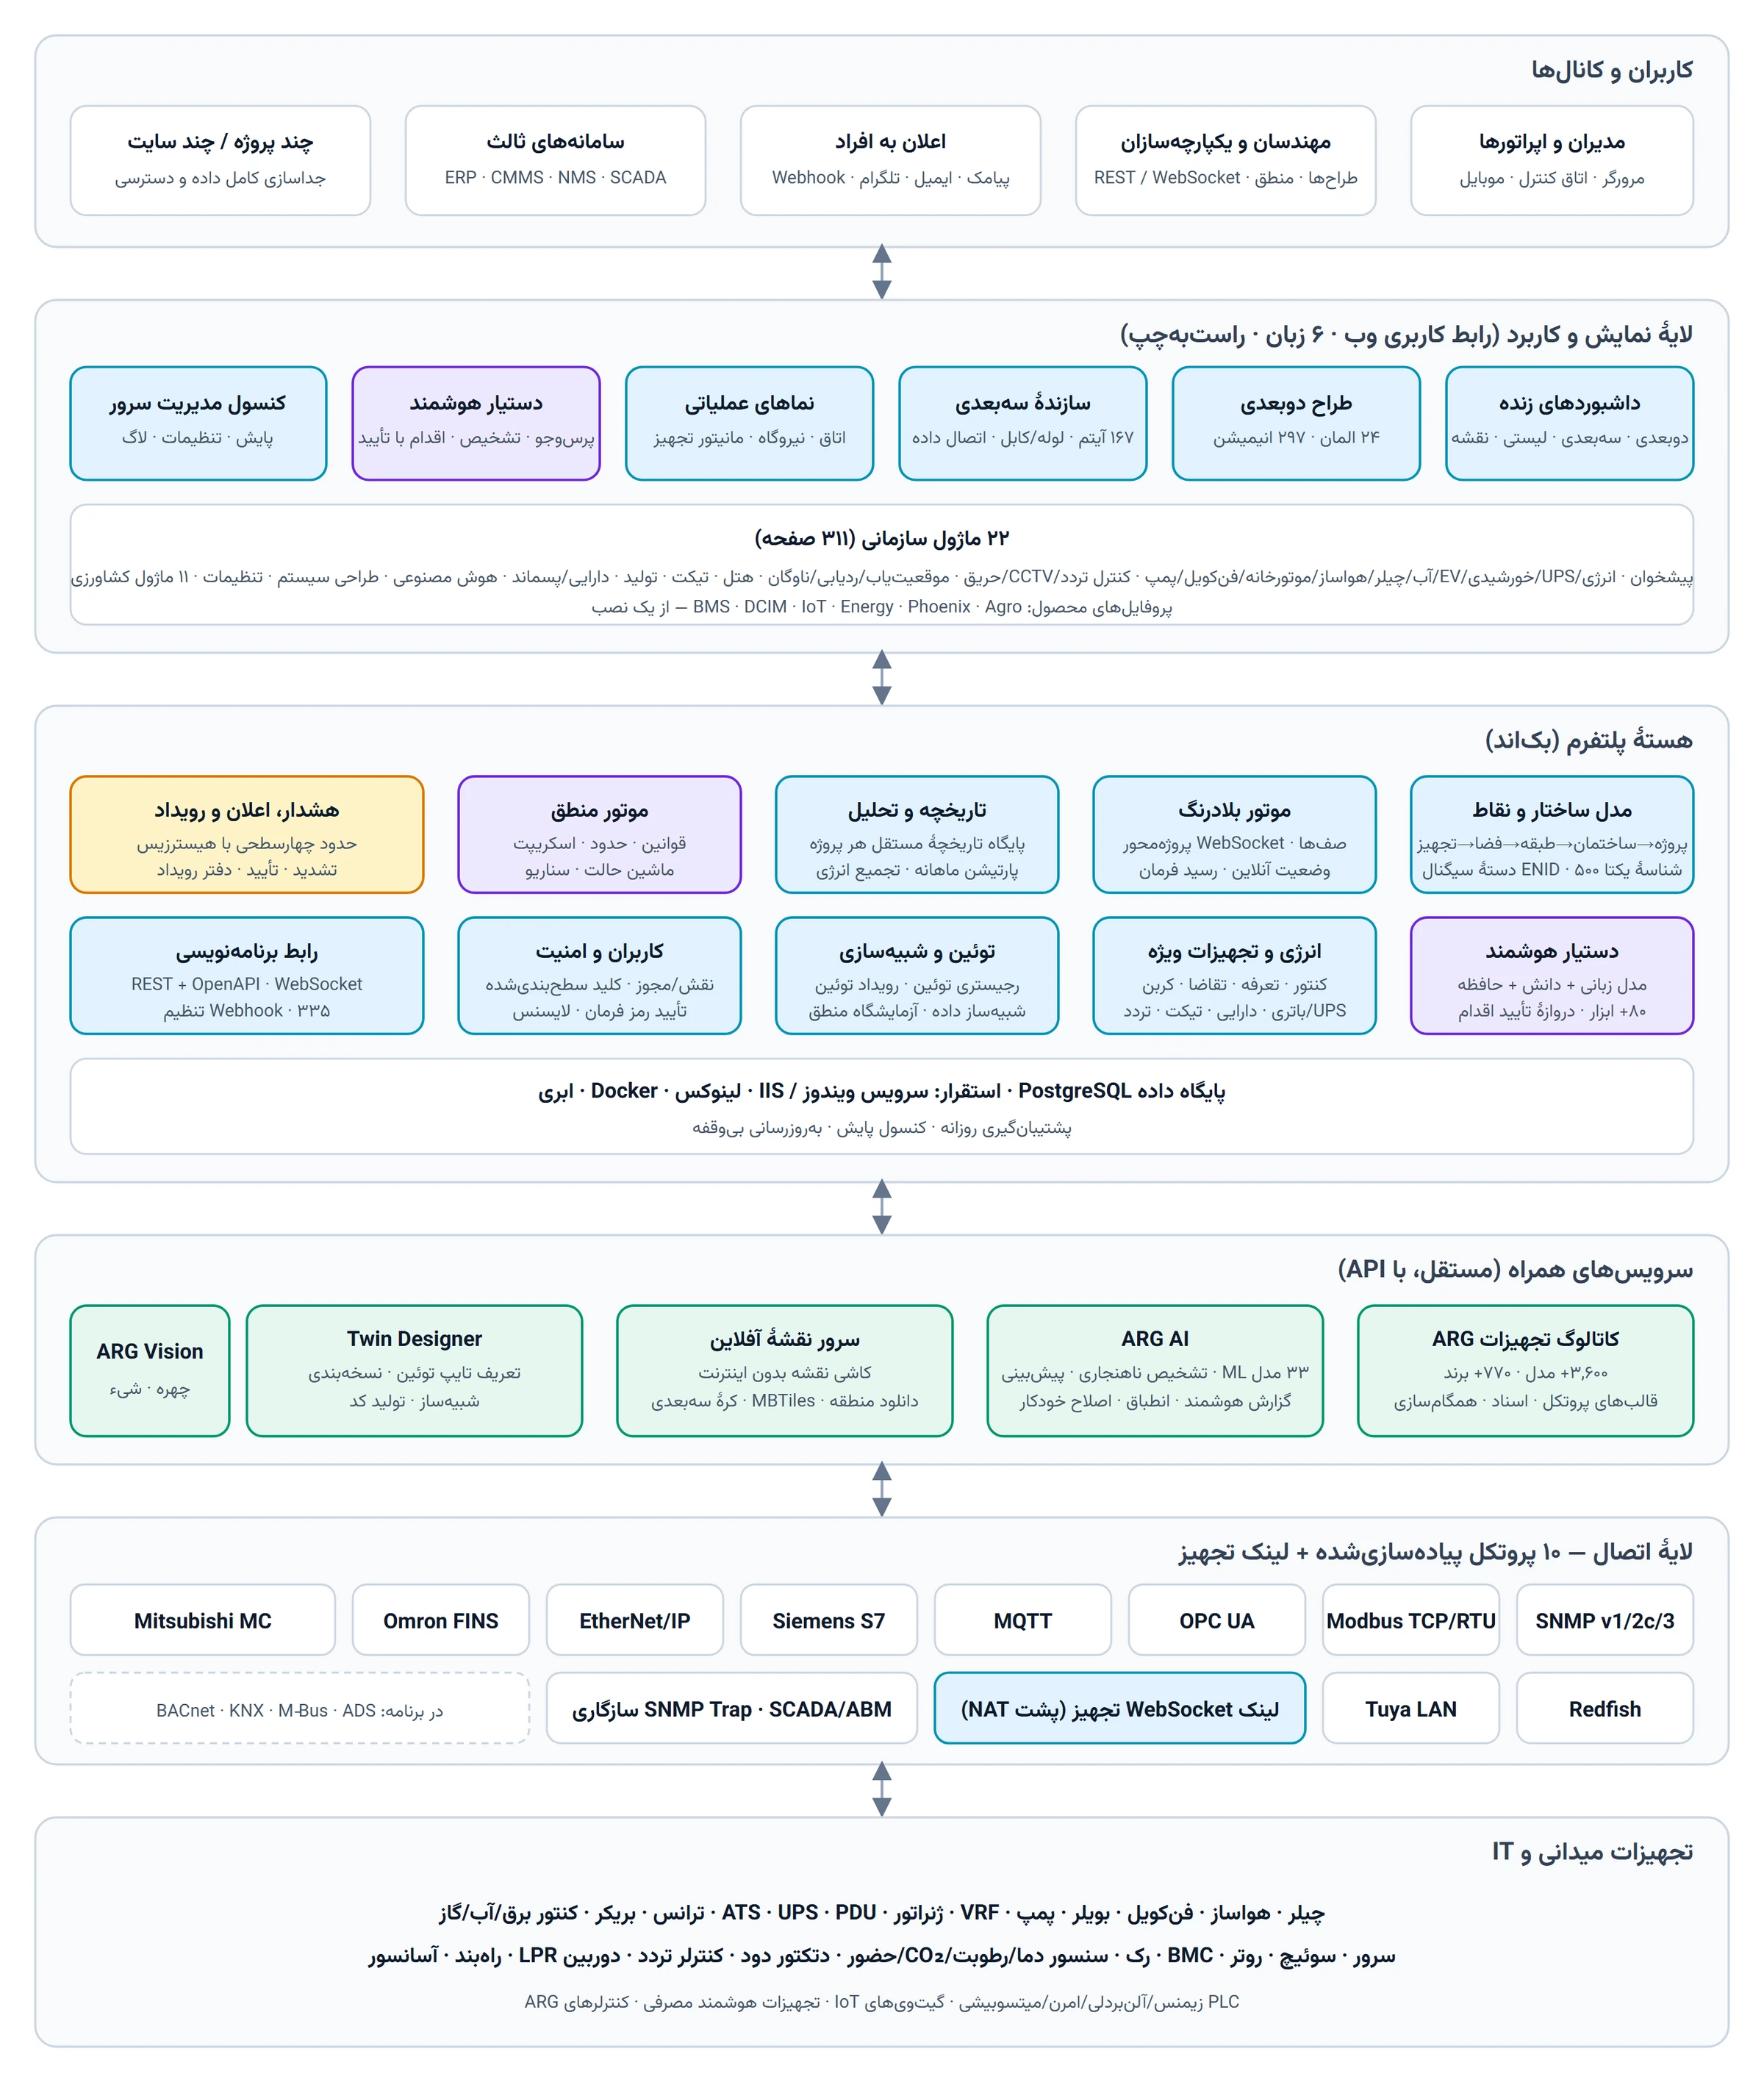
ARG Digital Twin is a live digital version of a physical infrastructure: every real piece of equipment (chiller, UPS, server rack, pump, transformer, sensor…) has a digital counterpart in the system that carries its real-time values, status, history, allowed limits and behavioral rules. Users see these counterparts on 2D dashboards or 3D scenes, issue commands, receive alerts, and define automation logic without writing code. Every process in an organization — from energy and facilities to security, assets, ticketing and production — becomes digital in a single system with a single sign-on.
| Aspect | Traditional BMS / SCADA | ARG Digital Twin |
|---|---|---|
| Equipment connectivity | Locked to a single protocol or brand; a gateway is needed to bridge to IT | 10 industrial and IT protocols in a single core; a catalog with ready-made points for 3,600+ models |
| Visualization | Static graphic screens; 3D versions are rare or purely decorative | 2D designer and 3D builder with every object live-linked to a point; offline maps |
| Automation | PLC programming / scripting by a specialist | No-code rules, scenarios, state machines + visual editor + test lab |
| Intelligence | Fixed reports | A smart assistant with data access and confirmed actions; ARG AI with 33 models |
| Enterprise scope | Facilities only | 22 modules: energy, security, assets, ticketing, production, hotel, tracking, agriculture |
| Multi-tenancy | A separate installation for each site | One installation, multiple projects with full isolation; product profiles |
| Integration | OPC or file-based | REST + OpenAPI, WebSocket, Webhook; companion services with their own APIs |
| Language and localization | English | 6 languages with genuine right-to-left support; local carrier SMS via SMPP |
| Deployment | Dedicated hardware / server | Windows, Linux, Docker, cloud — on enterprise PostgreSQL with replication and HA support |
The live ArgBMS demo with real 3D twins, dashboards and logic.