Deployment & delivery
Multilingual and multi-project, deployment on Windows, Linux, Docker or cloud, the project delivery method, the server console, product profiles and maintenance.
Multilingual, Multi-Project, and Product Profiles
Languages
Persian (default), English, Arabic, German, French, Russian — with a complete interface translation (about 17,000 strings per language) and genuine right-to-left layout for Persian and Arabic.
Multi-Project
One installation, multiple projects (customer/site) with fully separate data, keys, users, dashboards, and history. Users switch between their authorized projects with a single login.
One Product, Many Faces
From a single installation, a different product is presented depending on the customer; menus and modules are trimmed automatically, and administrators can turn modules on or off.
| Profile | Focus | Key Modules |
|---|---|---|
| BMS | Smart building management | Dashboard, energy, security, tracking, hospitality, ticketing, assets, AI, system design |
| DCIM | Data center | Racks and servers, UPS, cooling, power, ticketing, assets |
| IoT | Industrial Internet of Things | Energy, safety, tracking, assets, AI, design |
| Energy | Energy management | Metering, analytics, cost, demand, optimization |
| Phoenix | Full industrial edition | All BMS modules + production |
| Agro · Greenhouse · Field · Research | Smart agriculture | Climate, irrigation, lighting, crop, plant vision, harvest, genetics, knowledge, weather, compliance |
Deployment and Integration
Deployment Options
- Windows: Windows service or IIS package, with automatic install, update, and rollback
- Linux: systemd service · Docker: ready-made compose file with PostgreSQL
- Cloud (SaaS): hosted instance on ARG infrastructure with a dedicated domain
- Database: enterprise PostgreSQL — transactional, with replication and high availability at the database level; an independent history database per project
Integration
- Full REST API with OpenAPI/Swagger documentation for structure, equipment, points, dashboards, logic, energy, and alarms
- WebSocket for receiving live values and sending commands from third-party systems; outgoing webhooks
- Companion services with independent APIs: Device Catalog, ARG AI, Offline Map, Twin Designer
- WebSocket link for field controllers behind NAT, with no static IP required
Operations
- Server monitoring console: core, connections, queues, memory, services, logs, settings
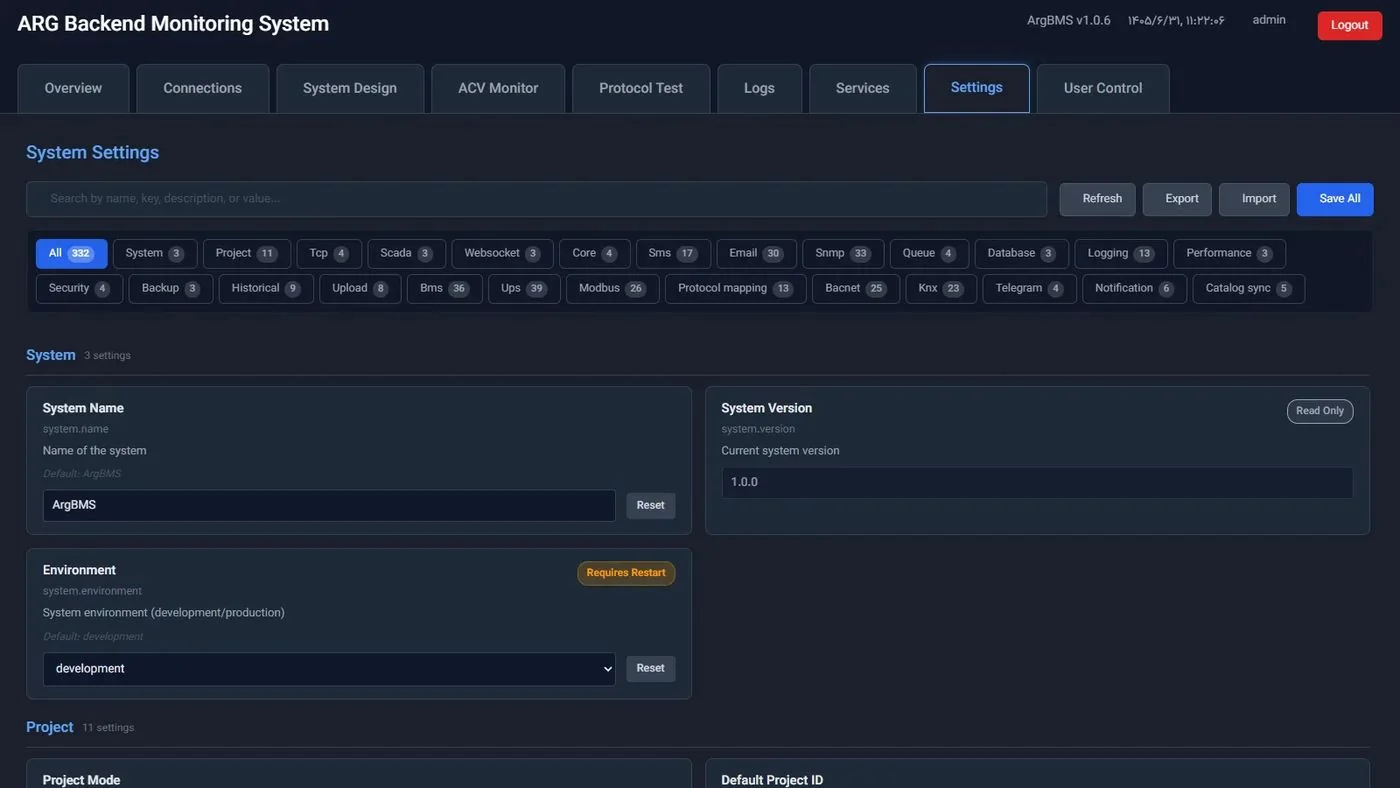
- 335 manageable settings with validation and export/import; daily backups
- Zero-downtime interface updates: users move to the new version with a single notification
Minimum Requirements
- Server: 4 CPU cores, 8 GB memory, 60 GB disk (for a 400-device instance)
- Modern browser with WebGL for 3D scenes
- Network access from the server to the equipment (or server deployment on the customer's local network)
Project Implementation Method
A typical project with 200 to 400 devices goes live in six steps, usually within 4 to 8 weeks. Most of the time is spent on network access and point validation with the customer's facilities team, not on the software.
| Step | Activities | Output |
|---|---|---|
| 1 · Discovery | Site visit, inventory of equipment and protocols, floor plans, network access (VLAN, firewall), definition of roles and notification recipients | Equipment inventory with protocol and address; network map |
| 2 · Deployment | Server installation (Windows/Linux/Docker or cloud), PostgreSQL, TLS certificate, companion services (catalog, offline map, ARG AI if needed), backups | System up and available with the product profile |
| 3 · Structure and Equipment | Structure import from Excel, equipment creation from the catalog (automatic points), customer-specific mappings, protocol tester for each device, limits and notifications per point | All points live and green in monitoring |
| 4 · Dashboard and Twin | 2D dashboards from templates, 3D scenes from the library (or the customer's GLB model), executive overview, map dashboard | Dashboard set broken down by role |
| 5 · Logic and Notification | Rules, scenarios, state machines; testing in the logic lab with the simulator; SMS/email/Telegram channels and escalation policy | Active, tested automation |
| 6 · Training and Handover | Training for operators and engineers, project documentation, joint monitoring period, final handover and support | Formal go-live |
Project Roles
- ARG Project Manager: schedule and delivery
- Automation Engineer: protocols and points
- Dashboard Designer: 2D/3D
- Logic Engineer: rules and scenarios
- Customer Representative: access, validation, acceptance
Service Options
- On-premise or cloud deployment with a dedicated domain
- Periodic monitoring and support; zero-downtime updates
- Custom driver or twin type development for the customer's specific equipment
- Integration with existing ERP/CMMS/NMS via API
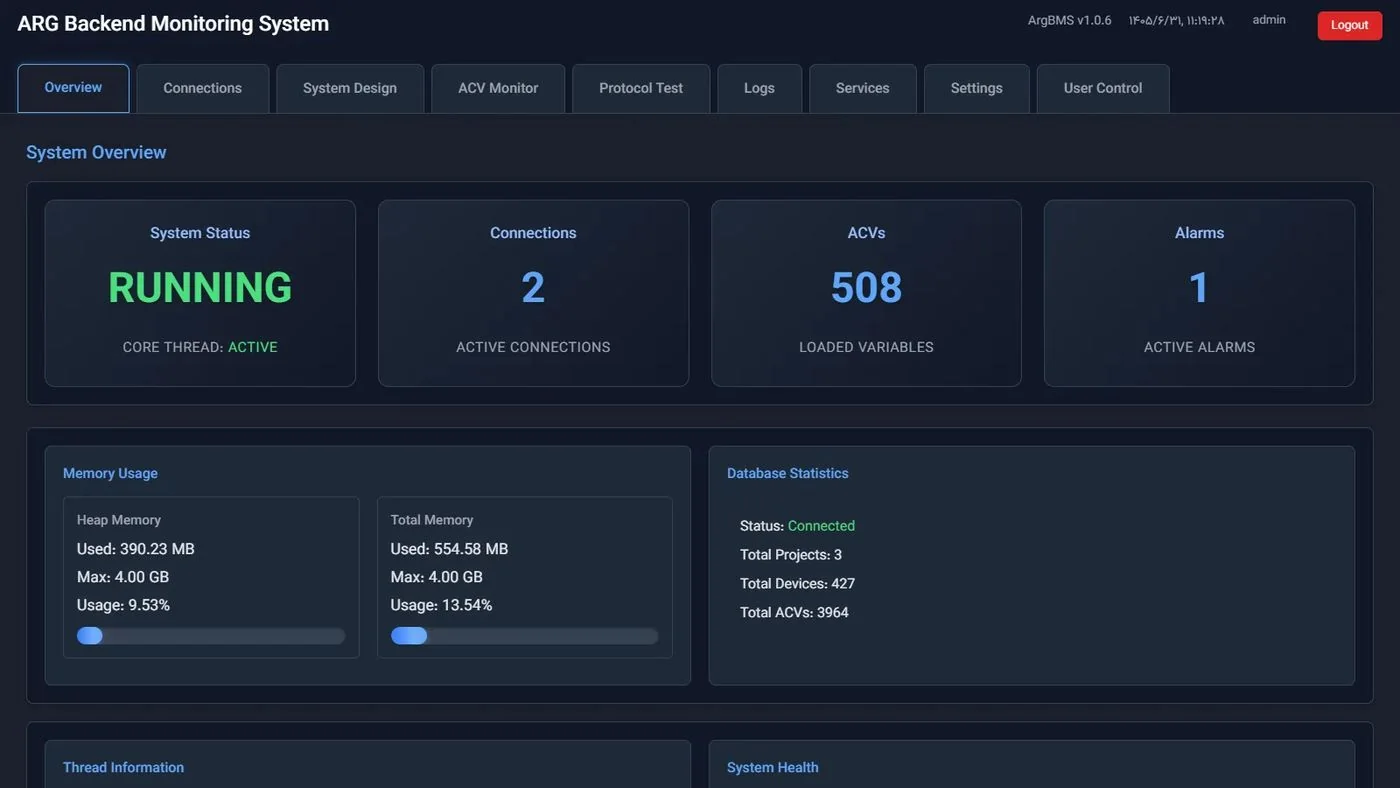
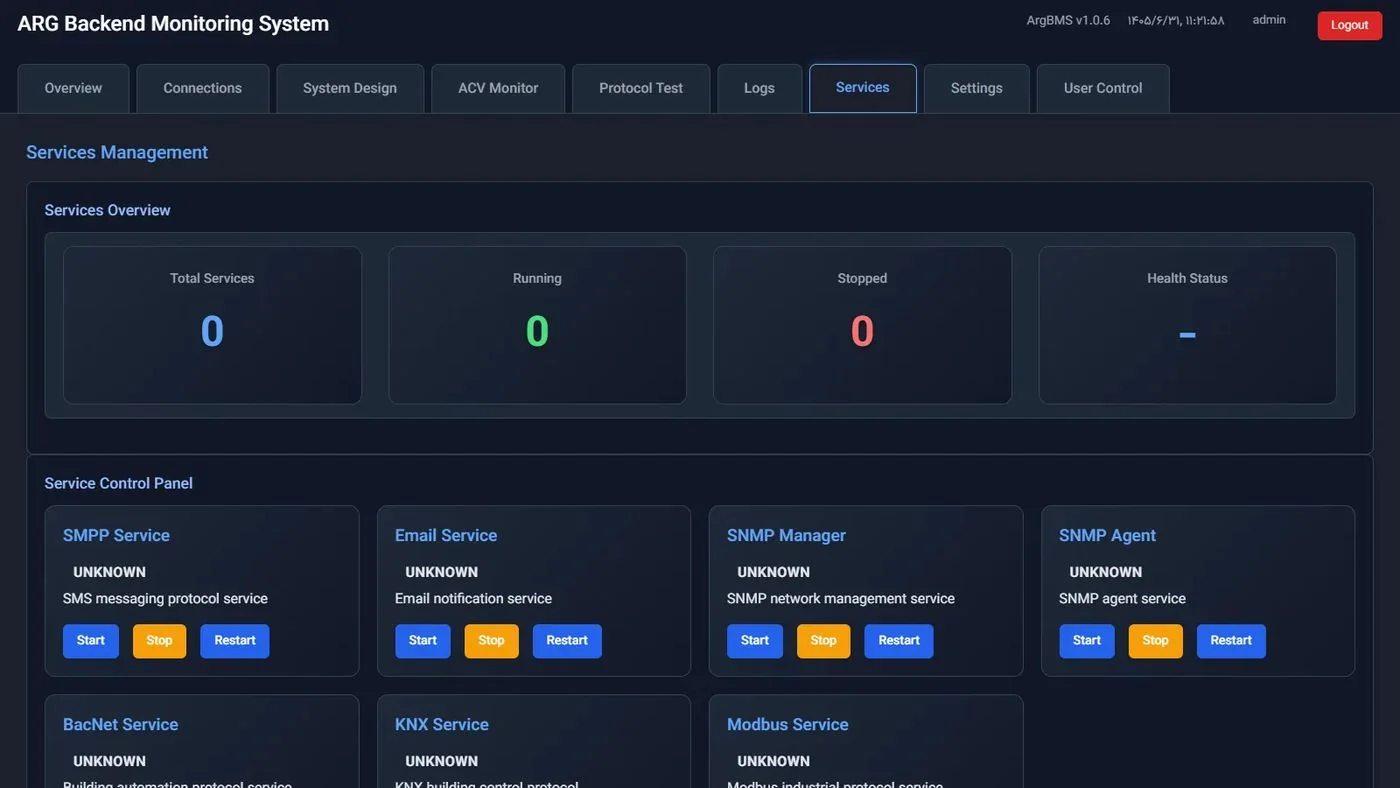
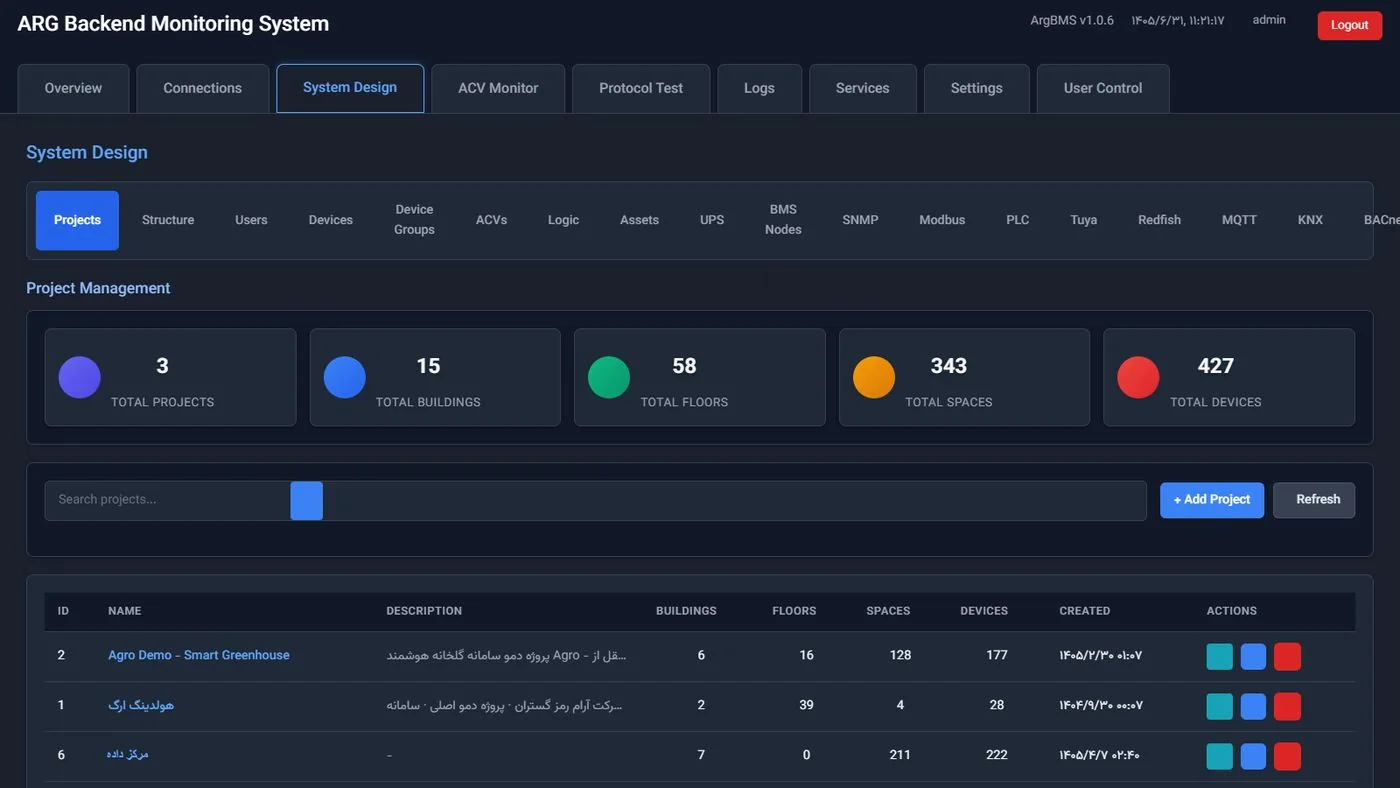
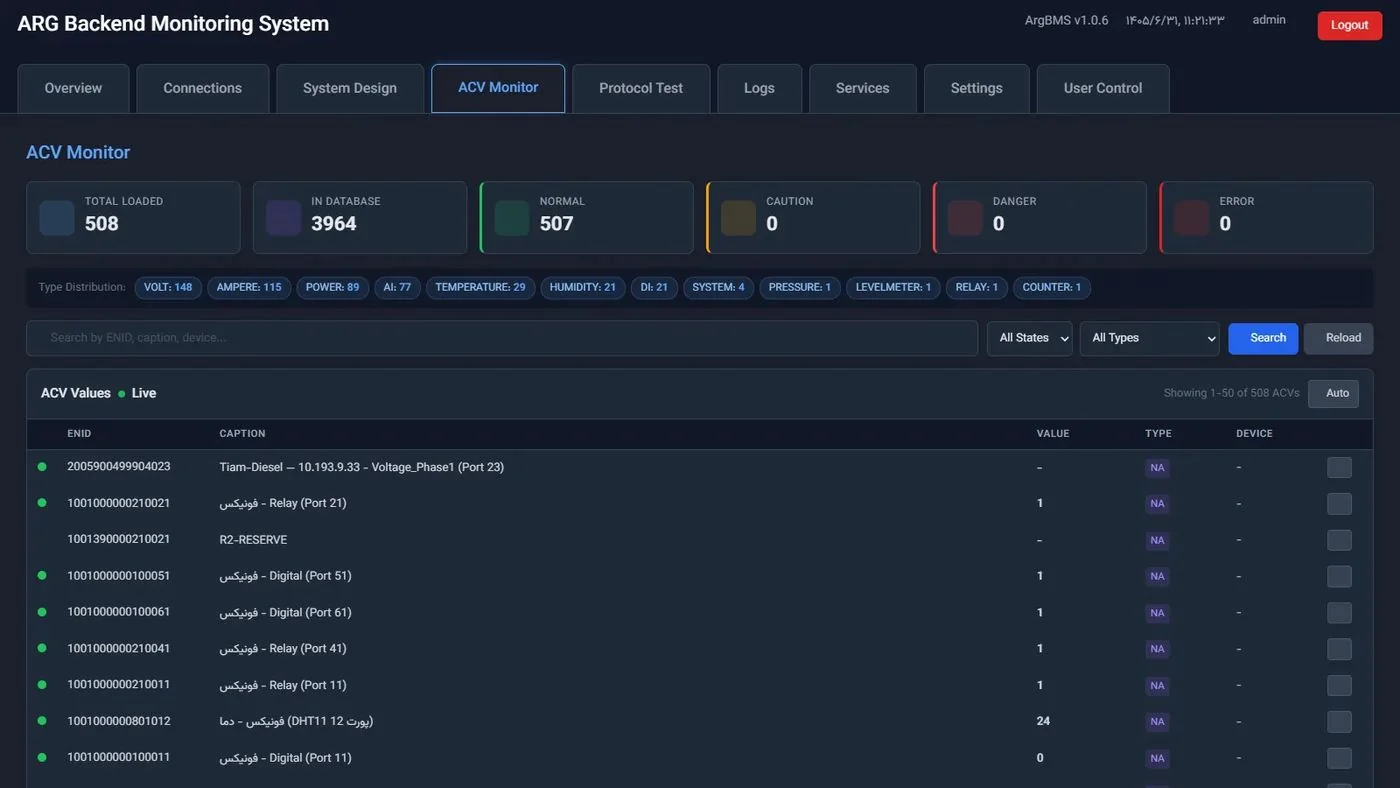
Server Management Console
Separate from the user interface, the server itself has a web management console that opens only with an administrator session: for the technical, support, and installation team. All of its tabs are listed below.
| Tab | Content |
|---|---|
| Overview | Core status (RUNNING/STOPPED), active connections, loaded points, active alarms, JVM memory, database statistics (projects, equipment, points), service health |
| Connections | TCP, WebSocket, SCADA, Modbus, SNMP, Redfish, PLC, and Tuya servers with client counts; list of web and device clients; polling services per protocol (equipment, online/offline, points) |
| System Design | Projects, structure, users, equipment, groups, points, logic (rules, state machines, scripts, scenarios), assets, UPS, BMS nodes, SNMP, Modbus, Tuya, Redfish, MQTT, KNX, BACnet |
| ACV Monitor | Status counters (normal/caution/danger/error), type and status filters, search, live values, point reload |
| Protocol Test | Console for sending test SCADA/Modbus/SNMP/Redfish/PLC/Tuya messages, with response logging |
| Logs | Live system log and command log; log level configurable per category |
| Services | Start/stop/restart of SMPP, email, SNMP Manager/Agent, BACnet, KNX, and Modbus services |
| Settings | 335 settings in categories, with save, export, and import |
| User Control | Console users, project keys, and access levels |
Product Profiles — Details
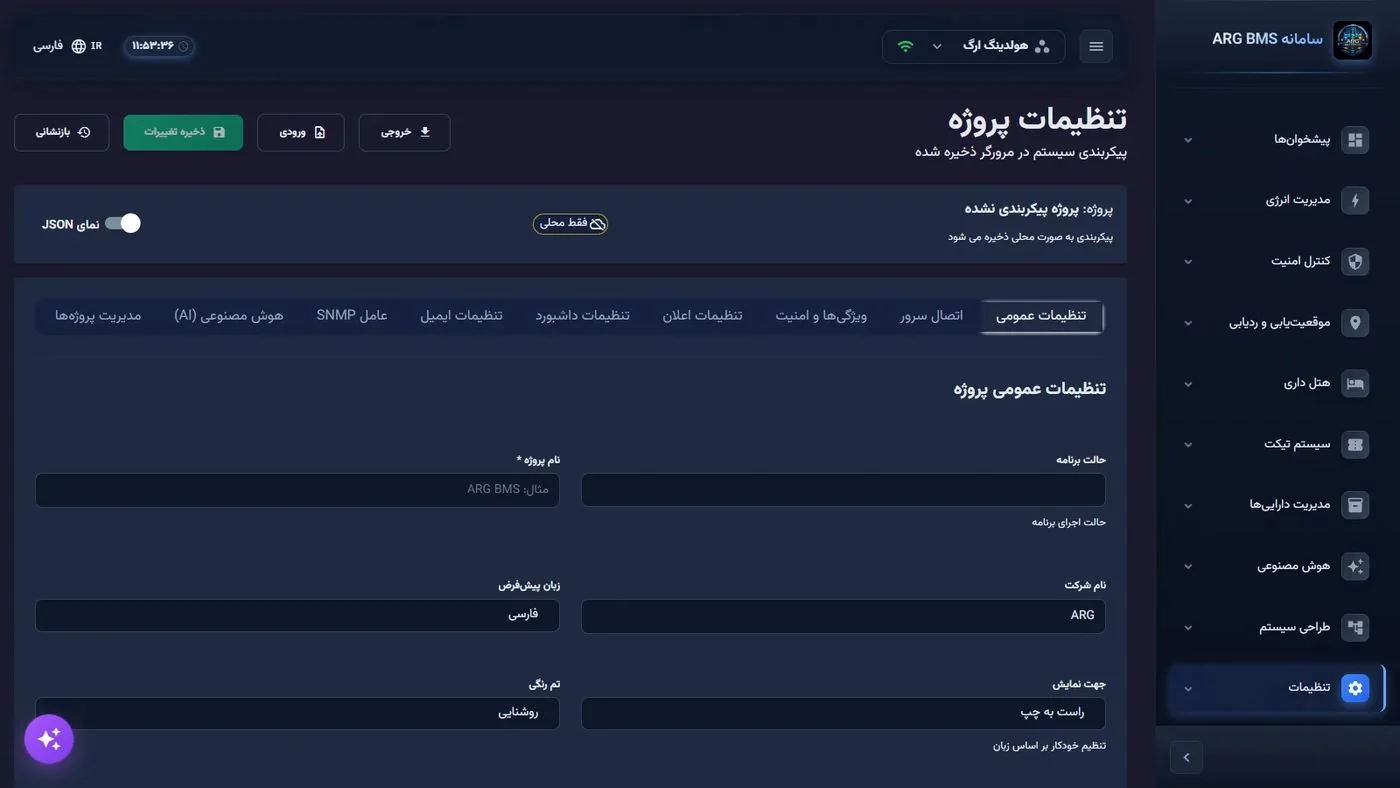
Each profile activates a subset of 22 module groups and changes the product's name and tagline. Within the same profile, administrators can turn groups on or off per customer; the data simulator is available in every profile.
| Profile | Groups | Active Groups | Target Customer |
|---|---|---|---|
| BMS | 10 | Dashboard, energy, security, tracking, hospitality, ticketing, assets, AI, system design, settings | Office/commercial buildings, complexes |
| DCIM | 8 | Dashboard, energy (UPS, cooling), security, ticketing, assets, AI, design, settings | Data centers, server rooms |
| Energy | 7 | Dashboard, energy, assets, AI, design, settings, ticketing | Energy management for industry and buildings |
| IoT | 8 | Dashboard, energy, security, tracking, assets, AI, design, settings | Industrial and IoT sites |
| Phoenix | 11 | All BMS groups + production management | Factories with Phoenix controllers |
| Agro | 20 | 11 agriculture groups + dashboard, energy, security, tracking, assets, AI, design, settings, ticketing | Smart agriculture |
| Greenhouse | 16 | Climate, irrigation, lighting, crop, plant vision, harvest, knowledge, analytics + infrastructure | Greenhouses |
| Field | 15 | Irrigation, crop, harvest, weather, genetics, compliance + infrastructure | Open-field cultivation |
| Research | 12 | Climate, genetics, plant vision, knowledge, analytics + infrastructure | Research centers |
| Combined | 22 | All | Full showcase |
Maintenance, Support, and Updates
Day-to-Day Maintenance
- Management console: core health, queues, memory, connections
- Automatic daily backups; periodic restore testing
- Rotating logs with configurable level per category
- Automatic cleanup of polling history (90 days) and old partitions per the retention policy
Updates
- Release package with the previous version pinned; staging → activation → one-command rollback
- Zero-downtime UI: users see a "new version" notification and update with one click
- Controlled database migrations; settings carried over via export/import
- The device catalog updates automatically (every 6 hours)
Support
- Operator and engineer training; project documentation
- Remote monitoring (with customer permission) and incident response
- Custom driver, twin type, or module development
Diagnostic Tools
- Protocol tester and protocol test console
- Live debug overlay for the data line in the browser (WebSocket/polling counters)
- Automatic collection of users' browser errors on the server
- Data simulator for reproducing conditions
See the Digital Twin live
The live ArgBMS demo with real 3D twins, dashboards and logic.