Enterprise Modules
Learn the menu map of the enterprise modules and, for energy, UPS, assets, and access control, know what each page shows and how to use it for monitoring.
«مدیریت انرژی»، «کنترل امنیت» ← «کنترل تردد»، «مدیریت داراییها» — «مدیریت انرژی»، «کنترل امنیت» ← «کنترل تردد»، «مدیریت داراییها» — «مدیریت انرژی»، «کنترل امنیت» ← «کنترل تردد»، «مدیریت داراییها» — Energy Management; Security Control → Access Control; Asset Management
Besides dashboards, the product has ready-made enterprise modules: energy, UPS, mechanical facilities, fire, access control, assets, and several others. In this lesson you learn the menu map for these modules and, for four sample modules (energy, UPS, assets, and access control), what each screen shows and how to use it for monitoring.
Get to know the screen: the menu map
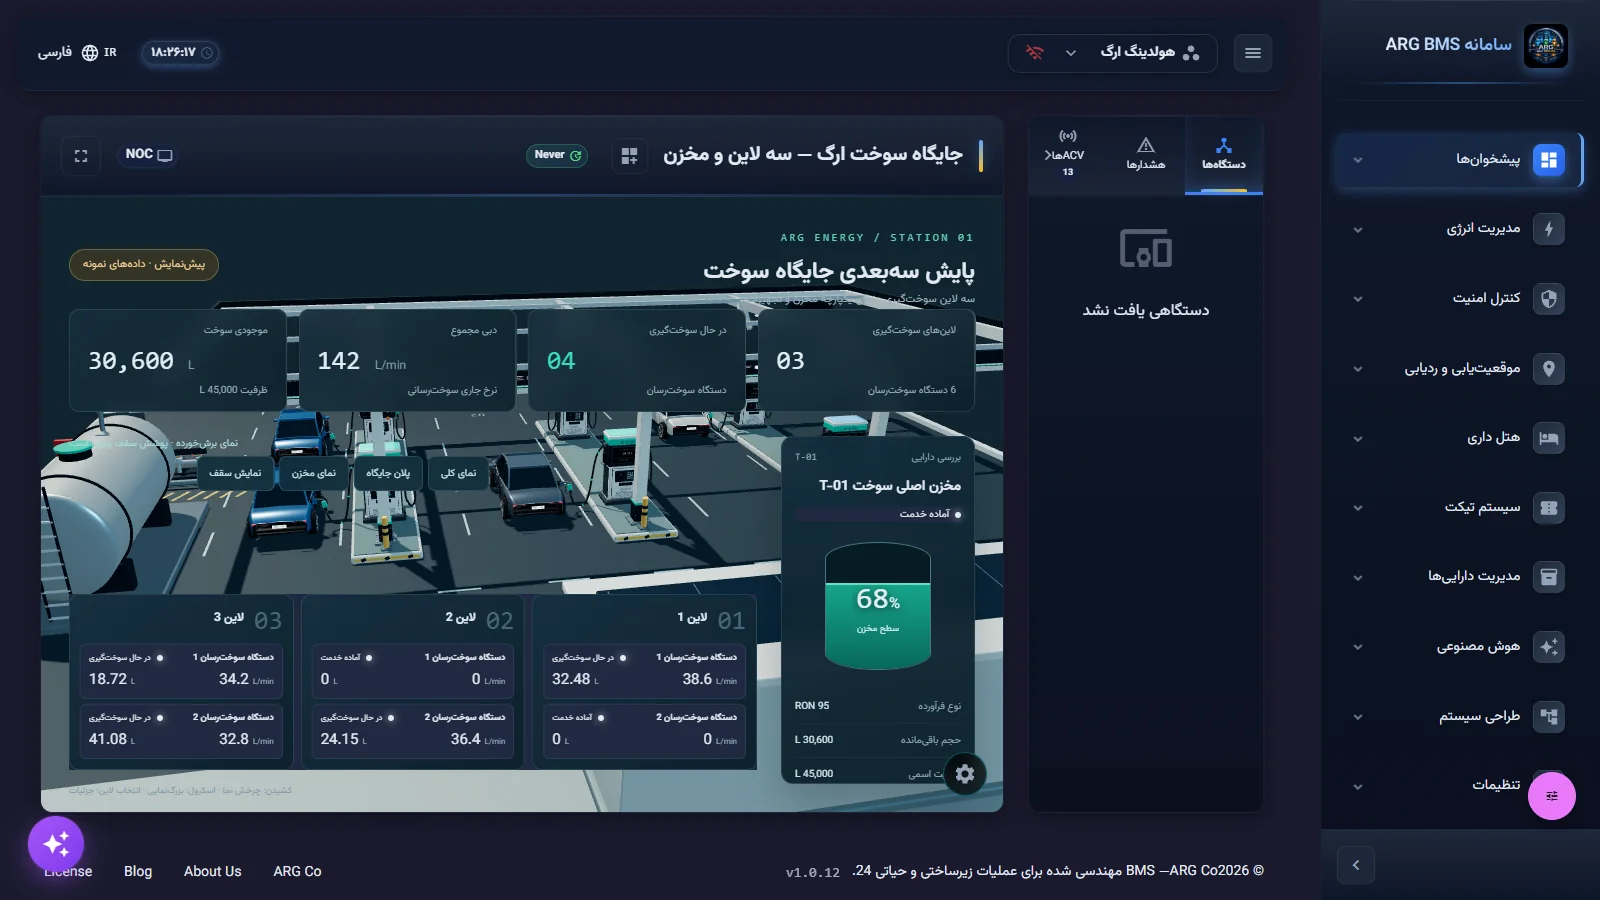
In the standard building-management configuration, the side menu has ten groups:
| Group | Subgroups and main pages |
|---|---|
| پیشخوانها (Consoles) | دیدکلی (Overview), داشبوردهای لیستی (List Dashboards) |
| مدیریت انرژی (Energy Management) | پایش انرژی (Energy Monitoring), مدیریت UPS (UPS Management), انرژی خورشیدی (Solar Energy), شارژ خودرو برقی (EV Charging), مدیریت آب (Water Management), مدیریت چیلر (Chiller Management), مدیریت هواساز (AHU Management), مدیریت موتورخانه (Plant Room Management), مدیریت فنکویل (Fan Coil Management), پمپ و الکتروموتور (Pumps and Motors) |
| کنترل امنیت (Security Control) | کنترل تردد (Access Control), دوربین مدار بسته (CCTV), ایمنی حریق (Fire Safety) |
| موقعیتیابی و ردیابی (Positioning and Tracking) | موقعیتیاب داخلی (Indoor Positioning), ردیابی دارایی (Asset Tracking), مدیریت ناوگان (Fleet Management) |
| هتل داری (Hospitality) | Rooms, reservations, guests, housekeeping, and more |
| سیستم تیکت (Ticketing System) | تیکتهای من (My Tickets), همه تیکتها (All Tickets), ایجاد تیکت (Create Ticket), گزارش SLA (SLA Report) |
| مدیریت داراییها (Asset Management) | فهرست داراییها (Asset Inventory), برنامه نگهداری (Maintenance Schedule), مدیریت هزینه دارایی (Asset Cost Management), اسناد و گارانتی (Documents and Warranty), مدیریت پسماند (Waste Management) |
| هوش مصنوعی (Artificial Intelligence) | Energy insights, anomaly detection, consumption forecasting, optimization, models, and chat |
| طراحی سیستم (System Design) | شبیهساز دستگاهها (Device Simulator), مدیریت ساختار (Structure Management), طراحی داشبورد (Dashboard Design), طراحی منطقی (Logic Design) |
| تنظیمات (Settings) | کاربران و دسترسیها (Users and Access), تنظیمات پروژه (Project Settings), کاتالوگ تجهیزات (Equipment Catalog) |
The facility modules (solar, water, chiller, AHU, plant room, fan coil, pumps) share the same pattern: مانیتورینگ (Monitoring), a unit list, تاریخچه (History), هشدارها (Alarms), نگهداری (Maintenance), and تنظیمات. Once you learn one, you know the rest.
Step by step
A — Energy
- View the meters. Open «مدیریت انرژی» ← «پایش انرژی» ← «مدیریت کنتورها» (Energy Management → Energy Monitoring → Meter Management). The کنتورهای فیزیکی (Physical Meters) tab shows meters with name, type, location, reading, and status, and کنتورهای مجازی (Virtual Meters) shows meters built from a formula over several meters. Use جستجو در کنتورها... (Search meters...) to narrow the list.
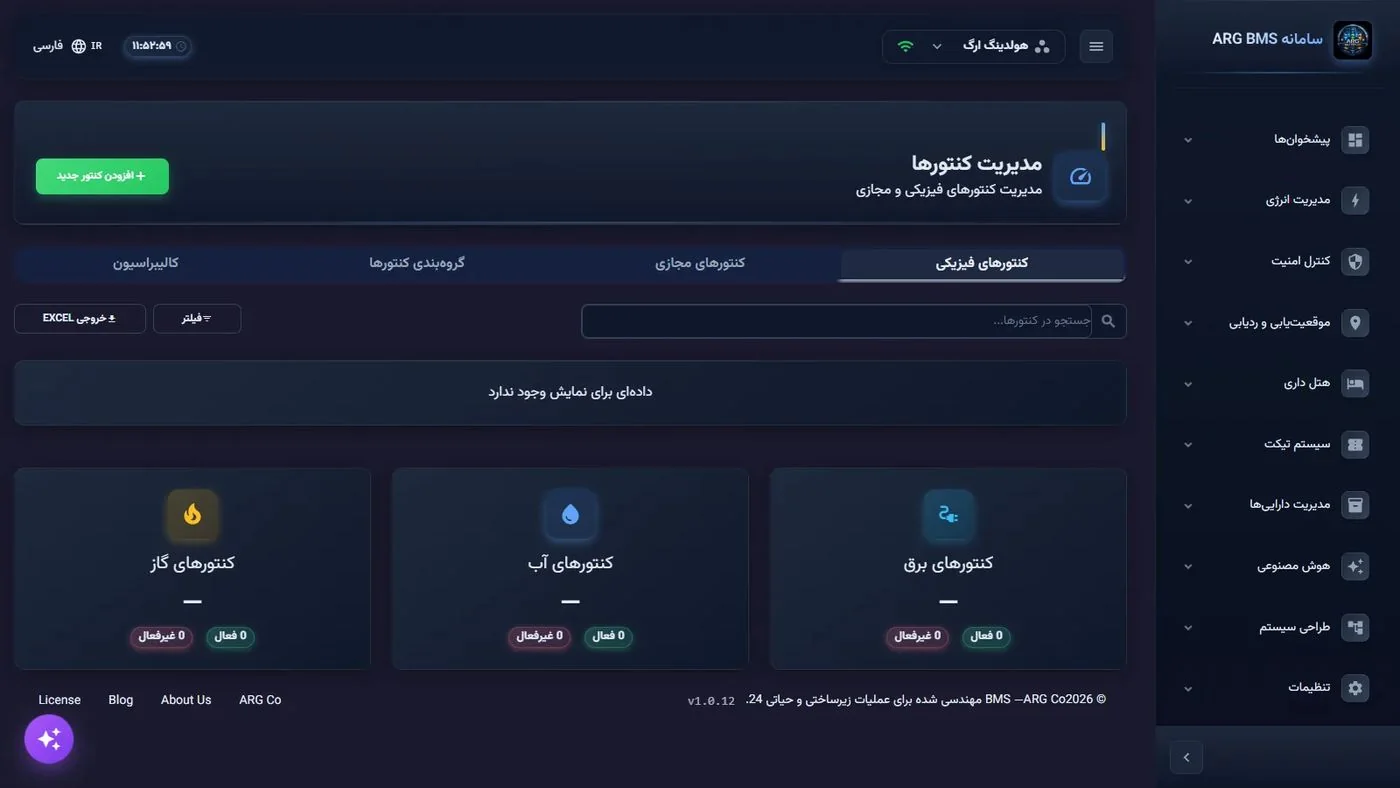
Meter Management · the Physical Meters and Virtual Meters tabs, with electricity, water, and gas meter cards - Analyze consumption. Open تحلیل مصرف (Consumption Analysis), pick a period (daily, weekly, monthly, or yearly) and a building, and read the مصرف کل (Total Consumption), میانگین روزانه (Daily Average), پیک مصرف (Peak Consumption), and بازده انرژی (Energy Efficiency) cards, and the روند مصرف انرژی (Consumption Trend) and توزیع مصرف (Consumption Distribution) charts. دانلود گزارش (Download Report) exports the report.
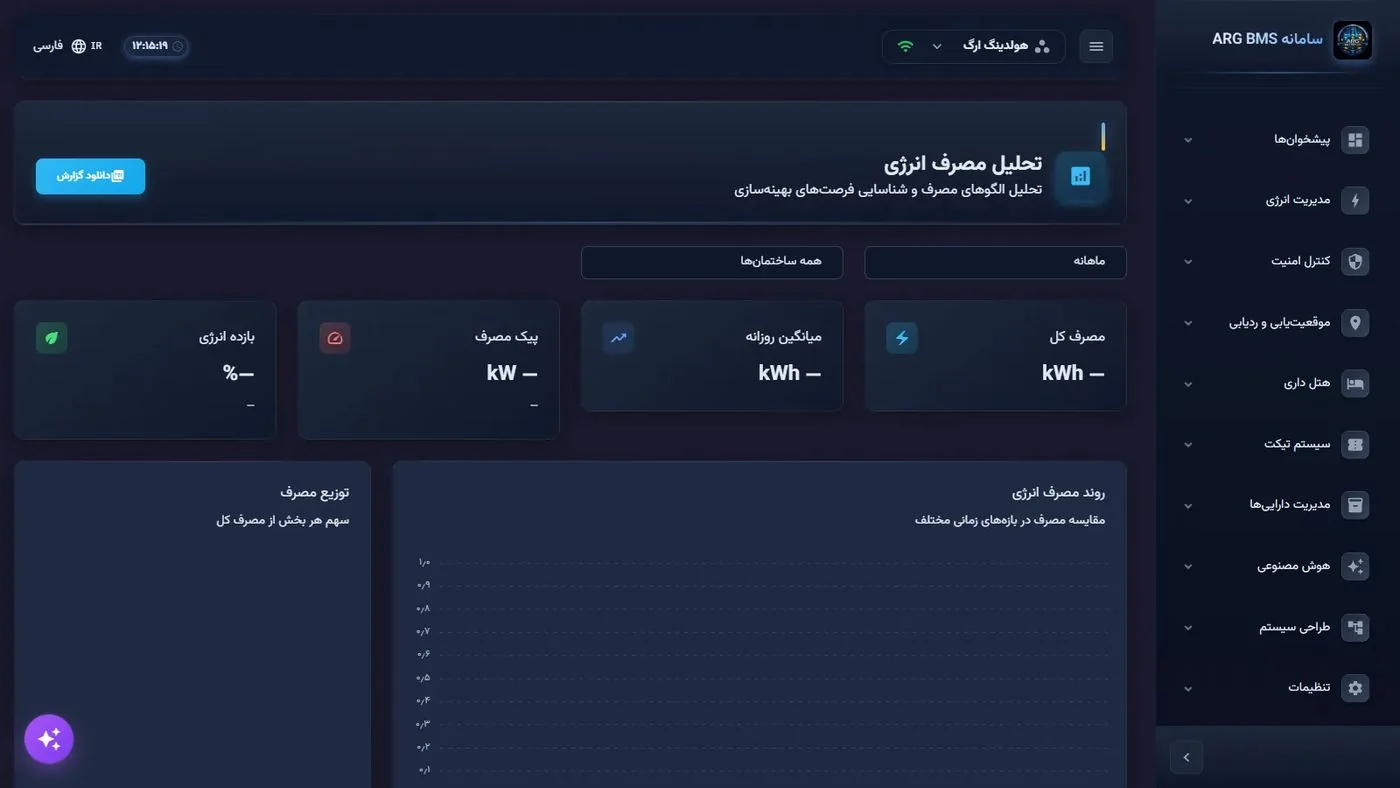
Consumption Analysis · period and building selection, indicator cards, and the consumption-trend chart - Review cost and demand. In مدیریت هزینه (Cost Management), see توزیع هزینه بر اساس تعرفه (Cost Distribution by Tariff) (off-peak, mid-peak, peak) and recent bills. In کنترل دیماند (Demand Control), monitor the instantaneous demand and its allowed limit.
B — UPS
- Monitor the overall status. Open «مدیریت انرژی» ← «مدیریت UPS» ← «مانیتورینگ» (Energy Management → UPS Management → Monitoring). The summary at the top shows the number of devices online, on battery, and with active alarms. Turn on بروزرسانی زنده (Live Update) to refresh the page automatically. Read the کل دستگاهها (Total Devices), آنلاین (Online), روی باتری (On Battery), هشدار بحرانی (Critical Alarm), میانگین بار (Average Load), and توان مصرفی (Power Consumption) cards.
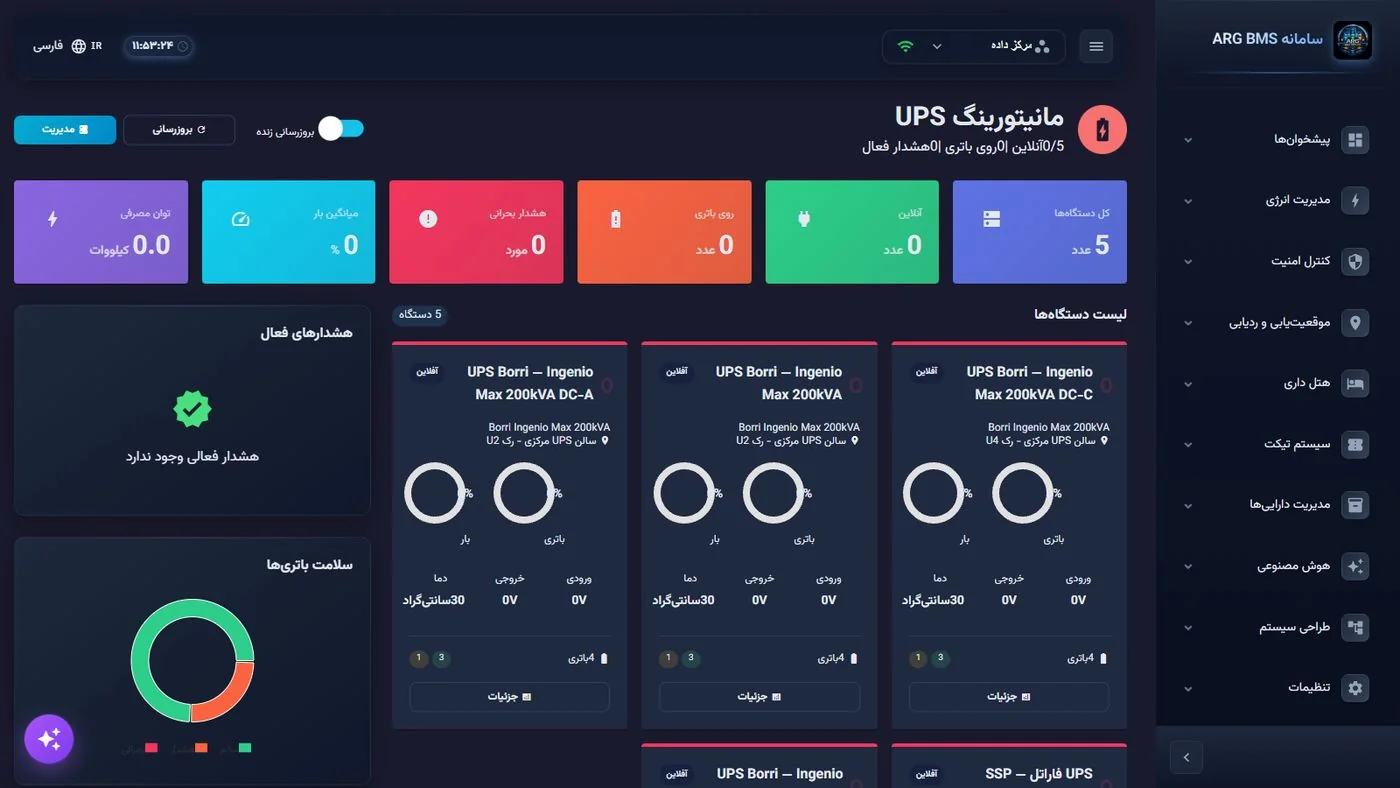
UPS Monitoring · indicator cards, a device list with battery, load, input, output, and temperature, and an active-alarms section - Check a single device. In the لیست دستگاهها (Device List), each UPS card shows battery charge, load, input and output voltage, and temperature. Click جزئیات (Details) to open that device's own page. The سلامت باتریها (Battery Health) section gives an overall picture of the batteries' condition.
- Filter the list. On the لیست دستگاهها page under the UPS menu, filter with جستجو... (Search...), وضعیت (Status) (for example, on battery), and موقعیت (Location), and clear filters with پاک کردن (Clear).
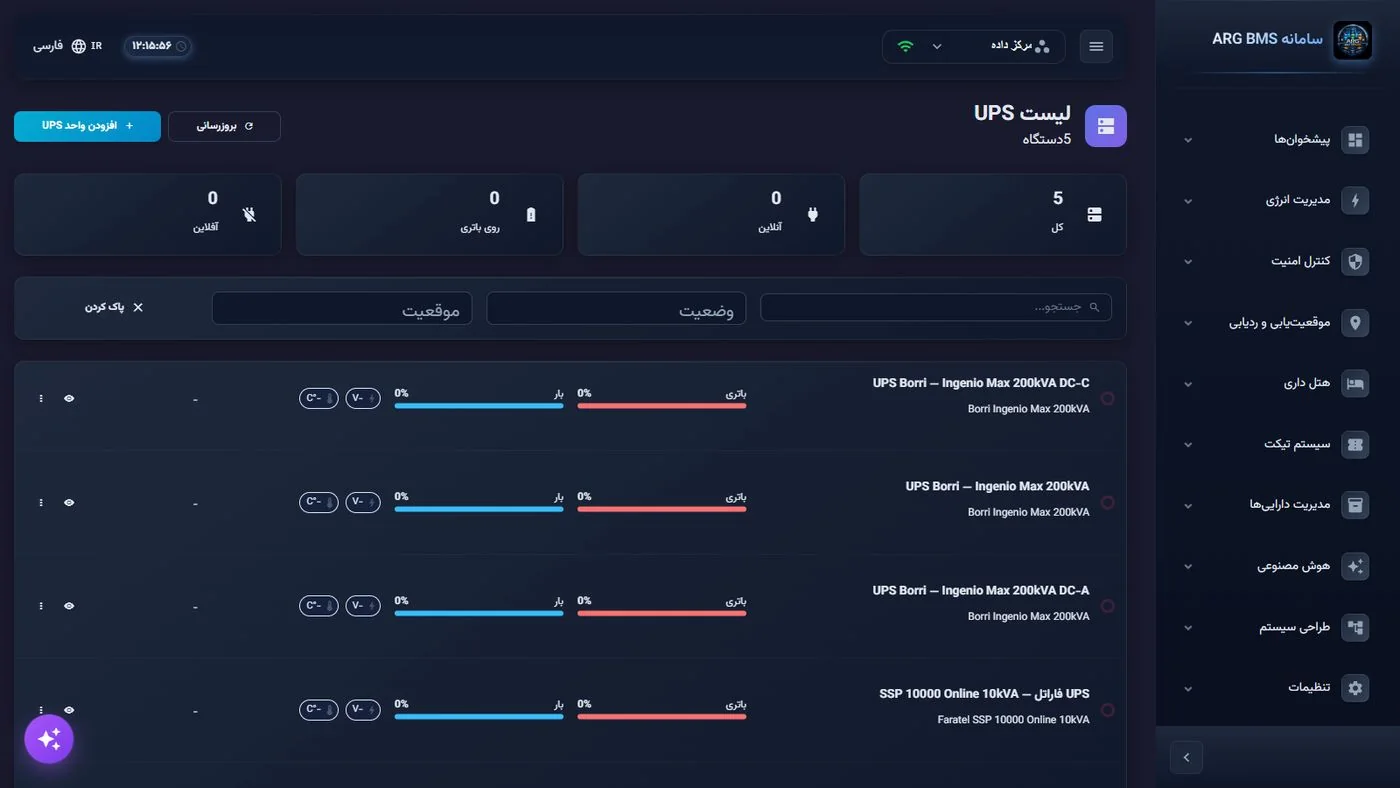
UPS List · total, online, on-battery, and offline cards, and search, status, and location filters - Read the digital twin. In دوقلوی دیجیتال (Digital Twin), pick an instance from نمونههای Twin (Twin Instances) and view its data source and quality under هویت دوقلو (Twin Identity). The تازه (Fresh), کهنه (Stale), تأییدنشده (Unverified), and خطادار (Faulty) cards show how many twins have up-to-date, valid data. This page is read-only (lesson B14).
C — Assets
- Browse the asset inventory. Open «مدیریت داراییها» ← «فهرست داراییها» (Asset Management → Asset Inventory). See the کل داراییها (Total Assets), ارزش کل (Total Value), در حال تعمیر (Under Repair), and نیاز به جایگزینی (Needs Replacement) cards. Narrow the list with the category tabs (تجهیزات IT (IT Equipment), سیستم HVAC (HVAC System), تجهیزات اداری (Office Equipment), وسایل نقلیه (Vehicles), تجهیزات امنیتی (Security Equipment)) and جستجو در داراییها... (Search assets...).
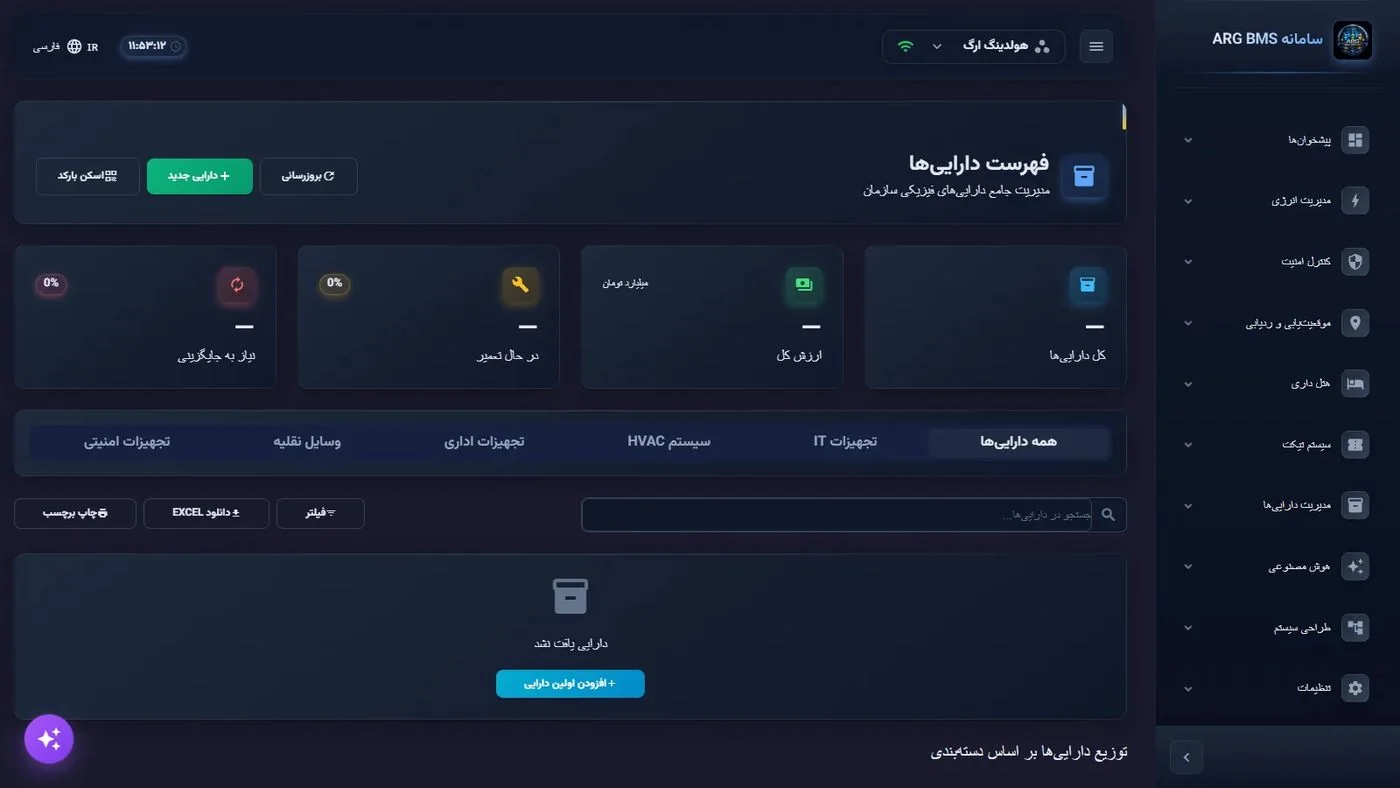
Asset Inventory · indicator cards, category tabs, and search and export tools - Find an asset by barcode. Click اسکن بارکد (Scan Barcode) and enter the barcode. The response is "Asset found: …" or "No asset found with this barcode".
- Export data. دانلود Excel (Download Excel) exports the list as a tabular (CSV) file. In مدیریت هزینه دارایی, download the گزارش مالی (Financial Report).
D — Access control
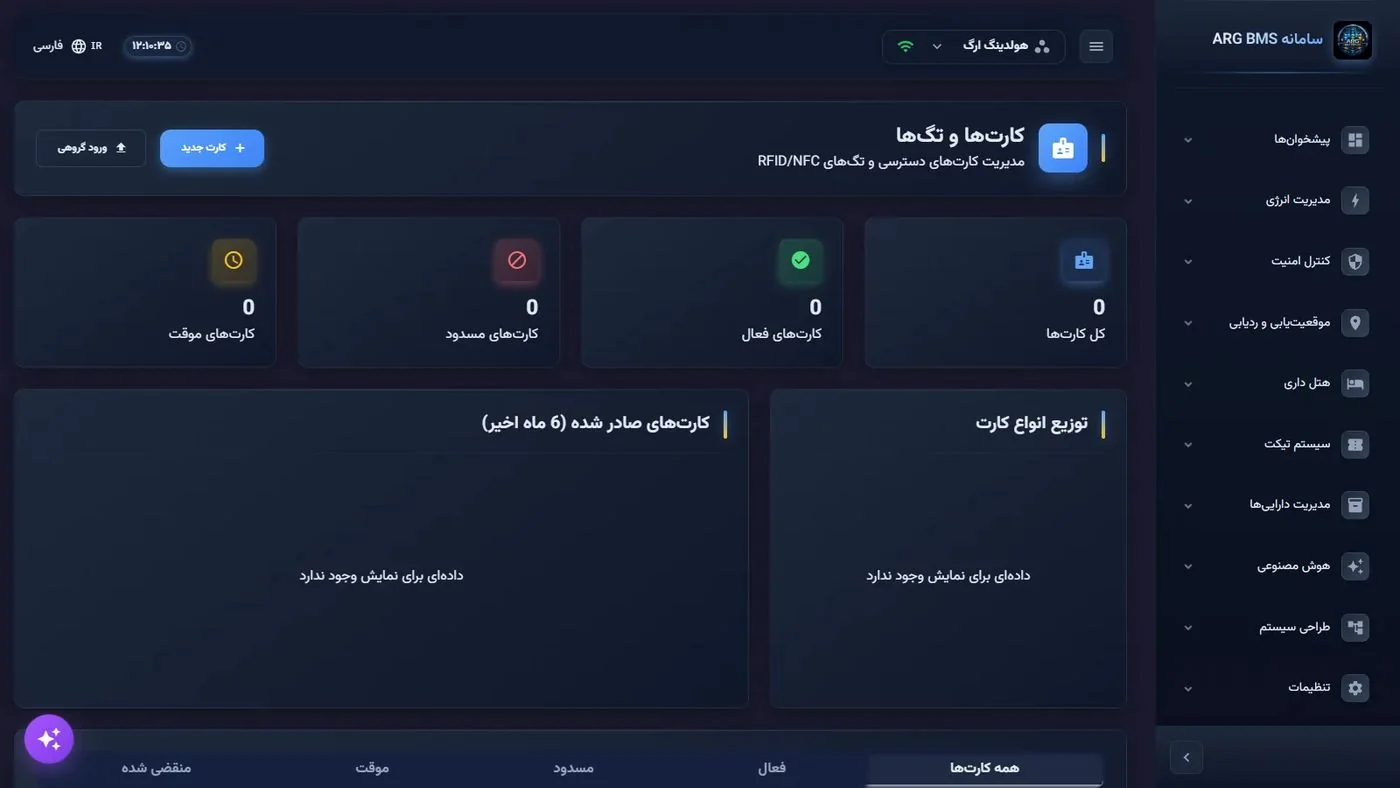
The کنترل تردد subgroup under کنترل امنیت has eight pages: مناطق دسترسی (Access Zones), گروههای دسترسی (Access Groups), مسیرهای تردد (Passage Routes), زمانبندی (Scheduling), کارتها و تگها (Cards and Tags), گزارشات تردد (Access Reports), آسانسورها (Elevators), and پارکینگ (Parking). In the current version, the zones, groups, routes, scheduling, cards, and reports pages are not connected to a data source and are an introductory view of the module's layout: the lists are empty and the forms save nothing. What you see on these pages:
- کارتها و تگها: indicators for total cards, active, blocked, and temporary cards; a chart of card-type distribution and cards issued over the last six months; card-status tabs.
- مناطق دسترسی: indicators for total zones, active and critical zones, and total devices; each zone's security level (critical, high, medium, low).
- گزارشات تردد: tabs for the access log, statistical analysis, denied access attempts, and attendance.
Other modules follow the same pattern
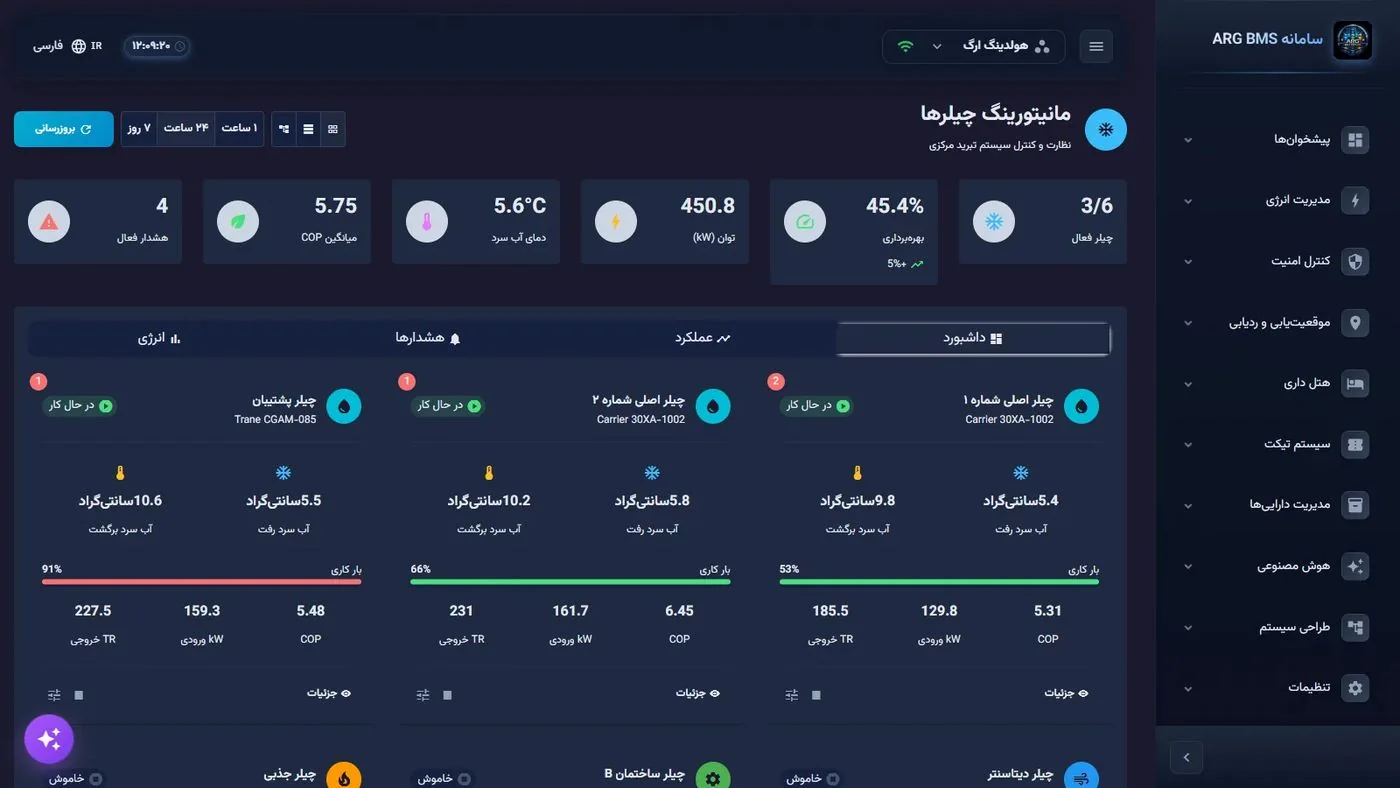
Monitor the remaining modules the same way. For example, «مدیریت انرژی» ← «مدیریت چیلر» ← «مانیتورینگ» (Energy Management → Chiller Management → Monitoring) shows indicators such as the number of active chillers, utilization, power, chilled-water temperature, and average COP, and gives each chiller's supply and return water temperature and load. «کنترل امنیت» ← «ایمنی حریق» ← «داشبورد» (Security Control → Fire Safety → Dashboard) also lists active fire alarms with the sensor's location and an تایید (Acknowledge) button for each alarm.
Tips and common mistakes
- The menu label for access is "Access Control", not "Permission Control".
- In simple tables, column headers are shown in English and uppercase (for example METER, STATUS, ACTIONS).
- Devices and points are defined in "Structure Management"; the modules are for monitoring and reporting.
- If a page is missing from the menu, check the system configuration and disabled pages with the administrator.
Summary
- The menu has ten groups, and the facility modules share the same Monitoring, units, history, alarms, maintenance, and settings pattern.
- In energy, "Meter Management", "Consumption Analysis", and "Cost Management" are the tools for monitoring consumption and cost.
- In UPS, "Monitoring", "Device List", and "Digital Twin" show battery status, load, and data quality.
- In assets, search, barcode scanning, and Excel export work.
- Access Control, in the current version, is an introductory view and is not connected to a data source.
Hands-on exercise on the live demo
Work on the public demo (bms.argsrv.com, project "ARG Holding"). This exercise is observation-only; do not record, edit, or delete anything.
- Open every side-menu group one by one and match them against this lesson's menu-map table. Note any group that differs.
- Open «مدیریت انرژی» ← «مدیریت UPS» ← «مانیتورینگ», turn on بروزرسانی زنده, and note the number of آنلاین and روی باتری devices.
- In دوقلوی دیجیتال, select a UPS and write down its data source and class.
- In تحلیل مصرف, select the "Monthly" period and report the پیک مصرف value.
- In فهرست داراییها, run a search and try دانلود Excel.
- In «مدیریت انرژی» ← «مدیریت چیلر» ← «مانیتورینگ», find the chiller with the highest load.
Lesson check
Answer at least 3 of 4 correctly to pass.
- 1. Which group is not shown in the menu under the standard building-management configuration?
- 2. What is the menu label of the access subgroup under "Security Control"?
- 3. How often does the server refresh energy meter readings?
- 4. Which page is best for real-time monitoring of UPS battery and load status?