The Server Management Console
Use the server's built-in web console to monitor core health, connections, data points, logs, and settings, and tell safe (read-only) operations apart from high-risk ones.
کنسول مدیریت سرور («ARG Backend Monitoring System»)؛ نشانی آن را مسئول استقرار در اختیار مدیر میگذارد — کنسول مدیریت سرور («ARG Backend Monitoring System»)؛ نشانی آن را مسئول استقرار در اختیار مدیر میگذارد — کنسول مدیریت سرور («ARG Backend Monitoring System»)؛ نشانی آن را مسئول استقرار در اختیار مدیر میگذارد — The server management console ("ARG Backend Monitoring System"); its address is provided to the administrator by the deployment lead
The server management console is not part of the user interface; it is a page the server itself serves, built for the system administrator, the support team, and installers. Its interface is in English and has nine tabs. Most tabs only show status, but a few buttons act directly on equipment or a service and have no confirmation prompt; knowing this distinction is the main goal of this lesson.
Get to know the screen
Logging in uses the Username and Password of an active account with "system access" and the Sign In button. Remember me only remembers the username, not the password. The header shows the version, clock, username, and a Logout button.
| Tab | Purpose | Safe | High-risk |
|---|---|---|---|
| Overview | Core health, memory, database, threads, queues | All cards | Restart Core Service, Reset Queue Stats (both have a confirmation) |
| Connections | Protocols, clients, polling services, device connection status | Cards, filters, the Test button | Starting and stopping each protocol's polling (no confirmation) |
| System Design | Projects, users, devices, points, logic, protocols, and keys | Viewing lists | Add, edit, delete, Send Command |
| ACV Monitor | Live point values and active alarms | Search, filter, Auto | Reload (reloads points on the server) |
| Protocol Test | Testing SCADA, Modbus, SNMP, Redfish, PLC, Tuya, and ENID | Test Connection, reading, Walk, Browse, Ping | Every Write and Send button, and Poll Now (no confirmation) |
| Logs | System log and command log (read-only) | All | — |
| Services | Controlling background services | Status cards | Start, Stop, Restart (no confirmation) |
| Settings | Server settings in various categories | Search, Refresh, Export | Save, Save All, Reset, Import |
| User Control | Change the username and password of the account you logged in with | — | Changing your own credentials |
The System Design tab at a glance
This is the console's most detailed section, with more than twenty sub-tabs: Projects (projects and keys), Structure, Users, Devices, Device Groups, ACVs, Logic, Assets, and protocol sub-tabs (SNMP, Modbus, PLC, Tuya, Redfish, MQTT, KNX, BACnet, M-Bus), plus Device Catalog and ENID Mapping. Most day-to-day work on structure and equipment happens in the web app; this tab is mainly for review, initial setup, and troubleshooting. Every add, edit, delete, or Send Command action in this tab affects real project data.
Step by step: a daily health check
- Check core status. In Overview, the System Status card should read RUNNING with the "Core Thread" active. Watch Heap Memory; the Message Queues cards should not stay constantly full. Read the Critical Alerts section.
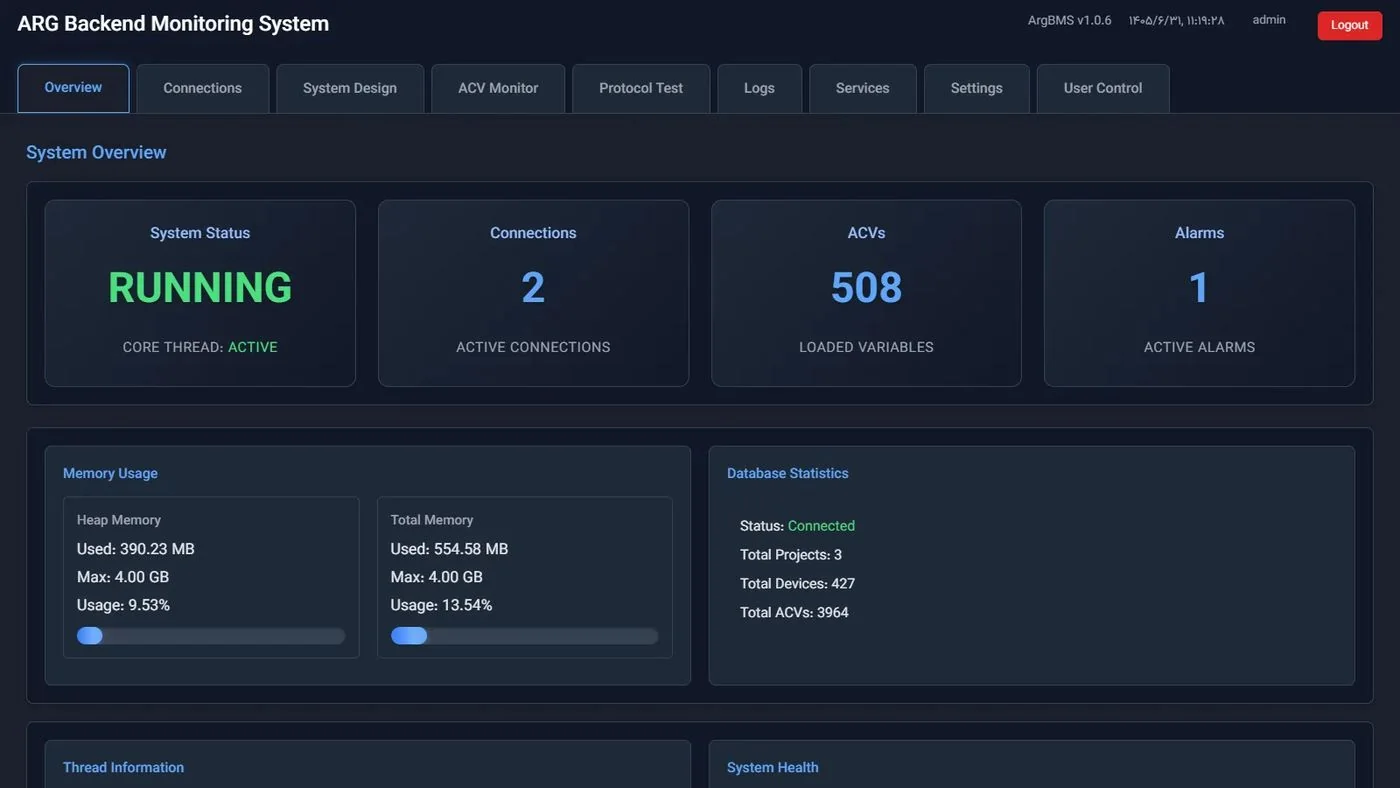
Overview · System Status, connection counts, loaded points, alerts, and memory usage - Review connections. In Connections, check the number of WebSocket clients (connected web users) and each protocol's status. In the Device Connection Status table, set the status filter to Offline and read the Last Poll and Errors columns. For a suspect device, click Test; the result is "Connection OK" or "Connection FAILED".
- Check the data points. In ACV Monitor, look at the Danger and Error counters and the Active Alarms section; search an ENID's identifier to find a point's live value. Use Search or Auto to refresh the table, not Reload.
- Read the logs. In Logs, review recent ERROR- and WARN-level messages. This tab is read-only; the log level is changed from the Logging category in Settings.
- Change a server setting. In Settings, find the setting by search or by category button. Before any broad change, click Export. Change the value so that Save appears for that setting, or save several changes at once with Save All. A setting flagged Requires Restart has no effect until the server restarts, and a yellow banner reminds you; Read Only cannot be changed. To revert, click Reset.
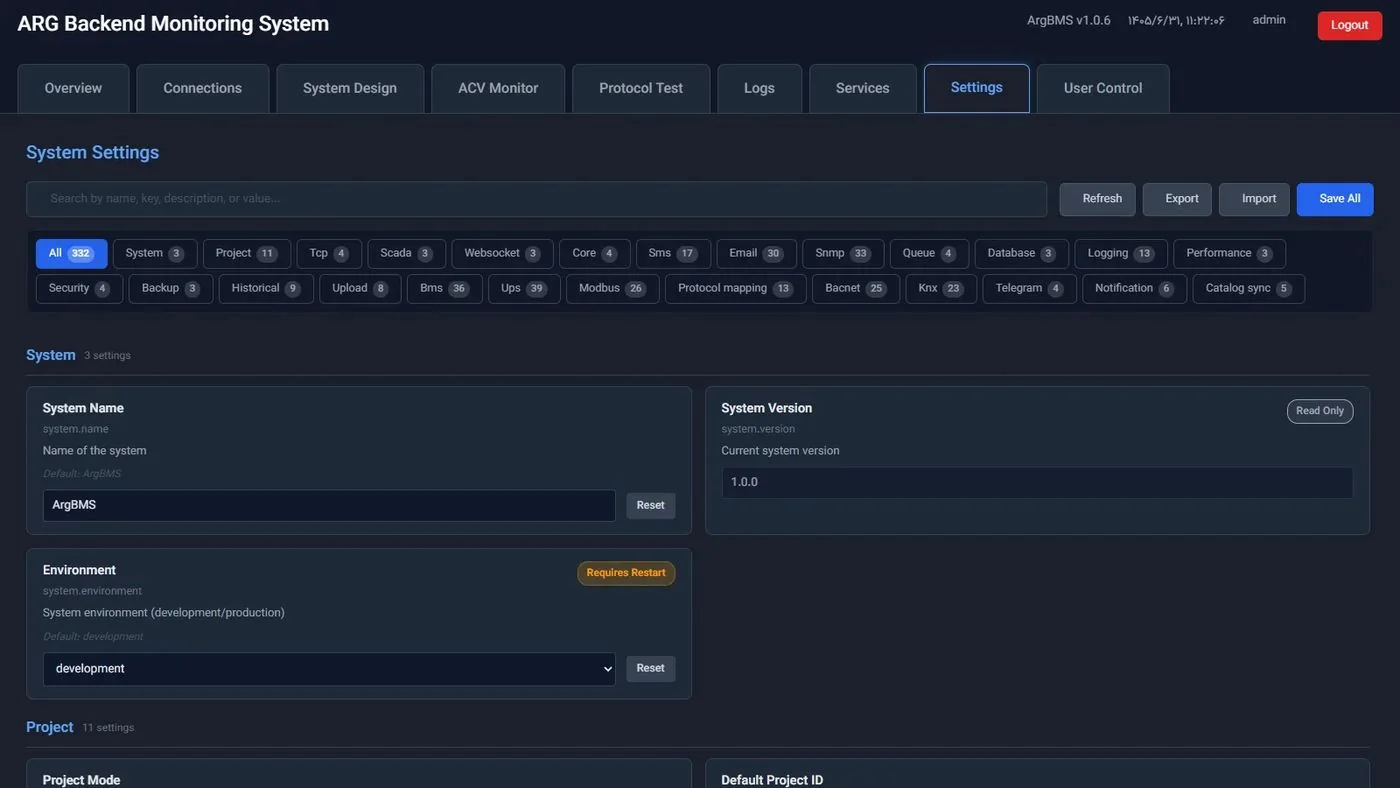
System Settings · the Refresh, Export, Import, and Save All buttons, categories, and the Read Only and Requires Restart badges - Change the console account's password. In User Control, under Change Password, fill in Current Password, New Password, and Confirm New Password, and click Change Password. Changing the username, under Change Username, works the same way, and a duplicate name is rejected. This tab only changes the credentials of the account you are logged in with; you cannot view or log out other users from here. Managing people and accounts happens in the web app (lesson C1).
Tips and common mistakes
- Write buttons in Protocol Test, stopping polling in Connections, and the Services buttons have no confirmation prompt; a single click affects a real device or service. On a live site, click these only with coordination.
- Restart Core Service restarts the processing core, and live values do not refresh during that gap.
- If the Services cards on your deployment show UNKNOWN, read protocol status from the Connections tab instead.
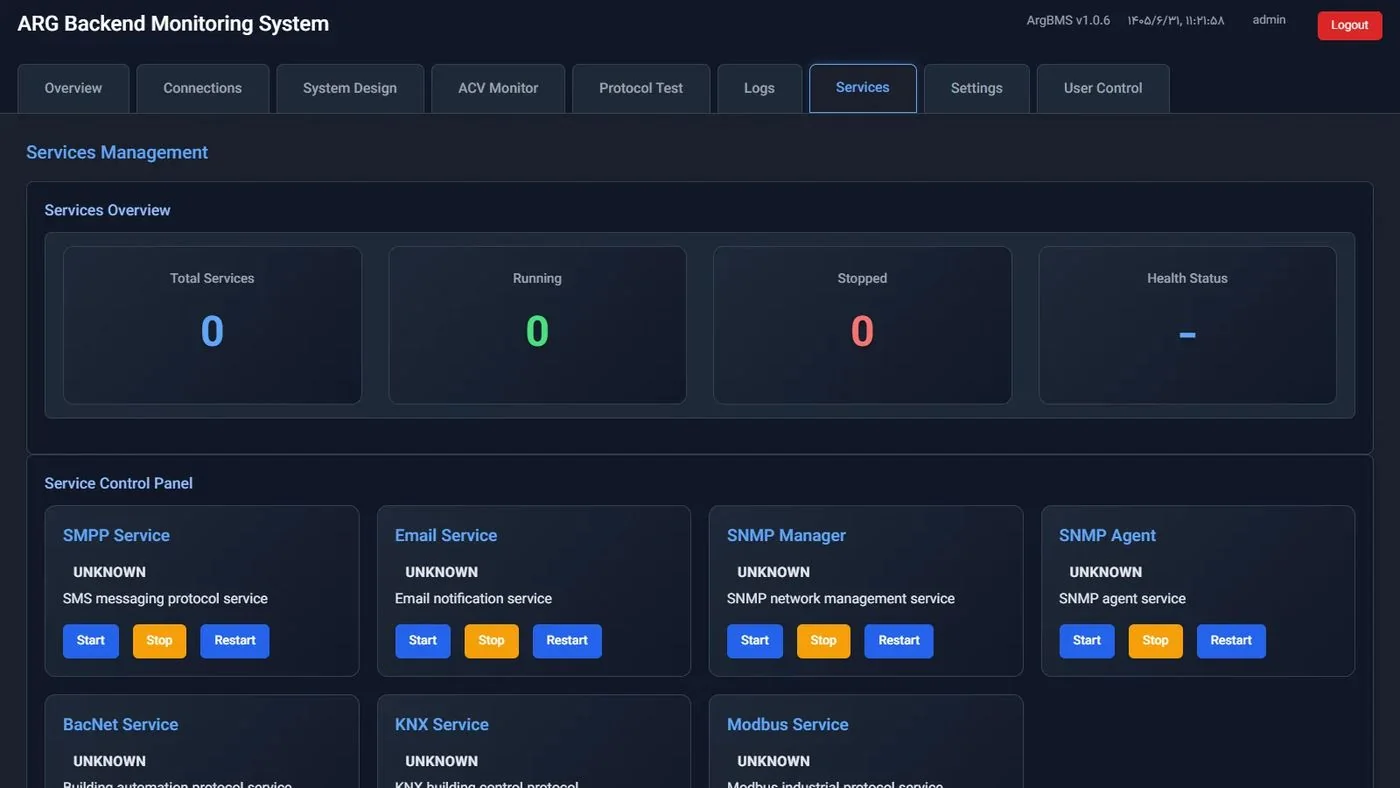
Services Management · service cards with Start, Stop, and Restart buttons - Import overwrites values for keys with the same name; always Export first.
- Grant "system access" (console login) only to trusted individuals, and set a strong password for the console account.
Summary
- The console is a tool for administrators and support, not regular users.
- Overview, Connections, ACV Monitor, and Logs are enough for a safe daily check.
- Write, Stop, Start, and Restart run without a confirmation prompt.
- "Requires Restart" means the change takes effect after the server restarts.
- User Control only changes your own account's credentials.
Hands-on exercise on the live demo
The server console is not open to the public on the demo. Do this exercise with the training account your instructor provides, using only safe operations; do not touch any Write, Stop, Start, Restart, Save, or Import button.
- In Overview, note the System Status value, heap usage, and the status of the three queues.
- In Connections, click the Offline filter and count offline devices per protocol.
- In ACV Monitor, search an ENID and note its value and type.
- In Settings, open the Security category and read the "Session Timeout (s)" value (do not change it).
- Recreate this lesson's safety table from memory: name one safe button and one high-risk button for each tab.
If you have no training account, follow the same steps using the lesson's screenshots.
Lesson check
Answer at least 3 of 4 correctly to pass.
- 1. Which tab is best for seeing the WebSocket client count and Modbus polling status?
- 2. Which action runs without a confirmation prompt?
- 3. What does the "Requires Restart" badge next to a setting mean?
- 4. What does the "User Control" tab do?