Trend and value history
Correctly read the live trend of values on a dashboard chart, set a time range for a UPS, view events and the parameter chart, and export a CSV.
نمودار داشبورد: «پیشخوانها» ← «دیدکلی»؛ تاریخچه: «مدیریت انرژی» ← «مدیریت UPS» ← «تاریخچه» — نمودار داشبورد: «پیشخوانها» ← «دیدکلی»؛ تاریخچه: «مدیریت انرژی» ← «مدیریت UPS» ← «تاریخچه» — Dashboard chart: «Dashboards» ← «Overview»; history: «Energy management» ← «UPS management» ← «History»
The operator has two kinds of time question: "What's the trend over these few minutes?" and "What happened yesterday or last week?". In this version, the answer to the first is the dashboard's live chart, and the answer to the second is the UPS module's "History" page. This lesson teaches the difference between the two and how to work with each.
Get to know the page
| Dashboard live chart | "UPS History" | |
|---|---|---|
| Data source | Values that have reached the browser since the page opened | Data stored on the server |
| Time range | Fixed, set by the designer (e.g. 1 hour) | "From date" and "to date" of your choosing |
| After refreshing the page | Starts from zero | Doesn't change |
| Export | — | خروجی (Export) to CSV |
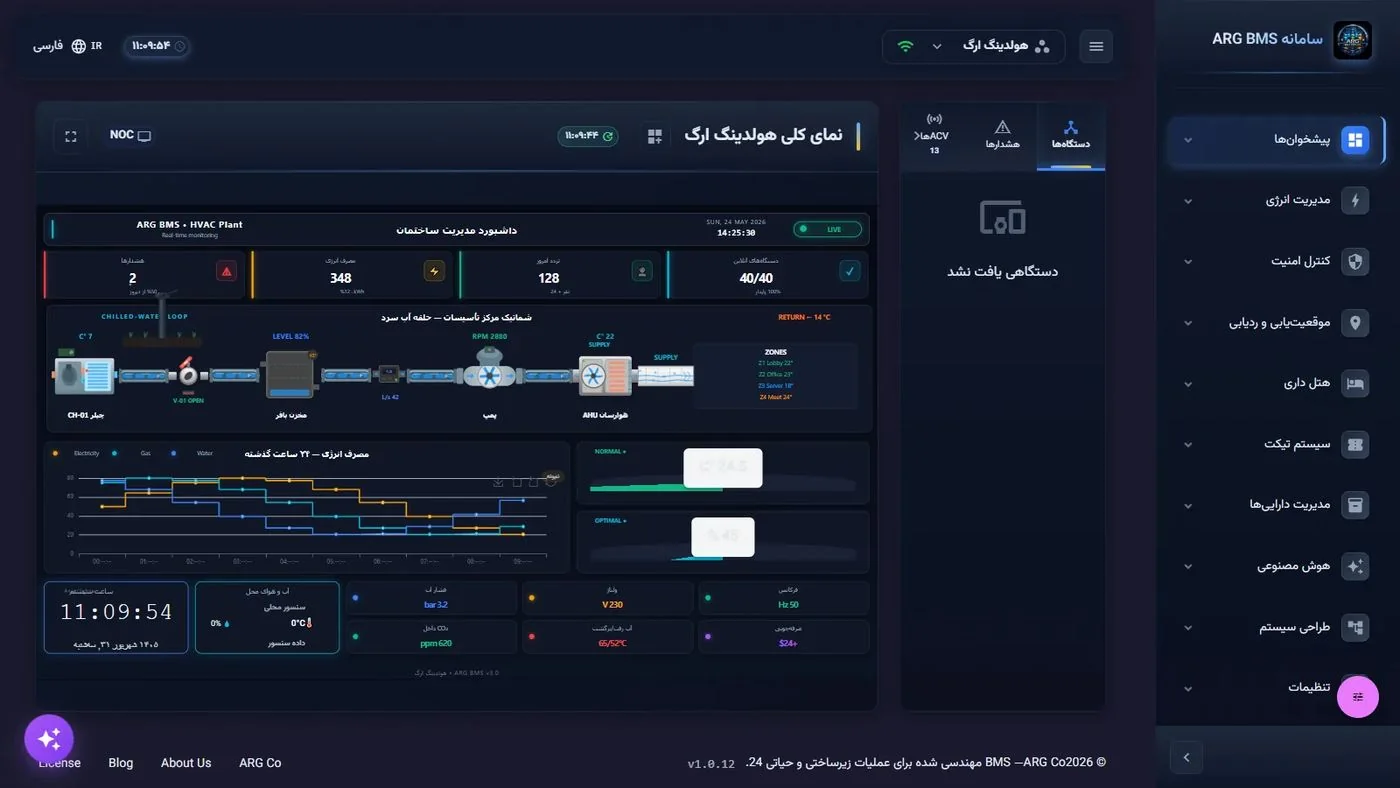
The dashboard chart is a line or bar chart and shows the time axis in Western hours. Until the first real value arrives, the orange نمونه (Sample) chip with the tooltip "Waiting for real data" sits on it, and the chart's shape isn't real yet. A "Σ n" chip means the chart has n computed (aggregated) series.
The "UPS History" page, subtitled "View historical UPS data and events", has these elements:
| Element | Purpose |
|---|---|
| انتخاب UPS (Select UPS) | The UPS device you want. |
| از تاریخ (From date) / تا تاریخ (To date) | Default: the past seven days through today. |
| جستجو (Search) | Loads data for the range. |
| "Parameter chart" card | The series "Battery charge (%)", "Load (%)" and "Input voltage (V)". |
| "Events" card | With an "N events" chip; the types "Power outage", "Power restored", "Low battery", "Critical battery", "Overload", "High temperature", "Test", "Bypass entered", "Bypass exited", "Maintenance"; paginated 20 per page. |
| خروجی (Export) | Downloads a CSV of the same range. |
Step by step
a) Live trend on the dashboard
- Keep the dashboard open. Open a dashboard that has a chart. It fills from this moment on; the longer the page stays open, the longer a trend you see.
- Recognize the "Sample" chip. As long as this chip is on the chart, its shape isn't real and you shouldn't make decisions based on it.
- Ask the designer for a different range. The chart window's time range is set by the dashboard's designer; ask an engineer if you need a different one.
b) UPS history
- Open the page. «مدیریت انرژی» ← «مدیریت UPS» ← «تاریخچه» (Energy management ← UPS management ← History).
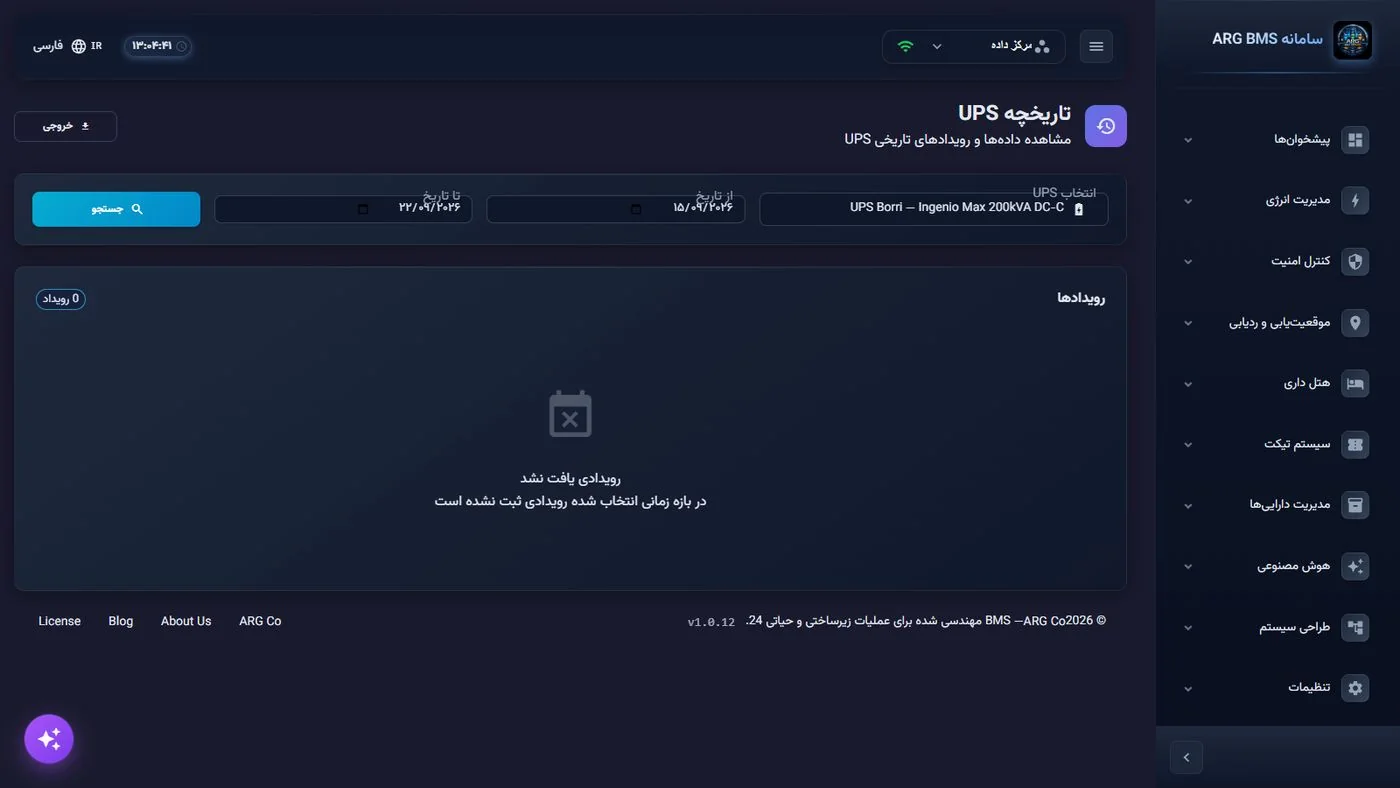
"UPS History" page · "Select UPS", "From date", "To date", "Search" and "Export"; no event is logged in this range here - Select the device. Choose the device you want in انتخاب UPS.
- Set the range. Set "From date" and "To date"; make sure "From date" comes before "To date". Then click جستجو.
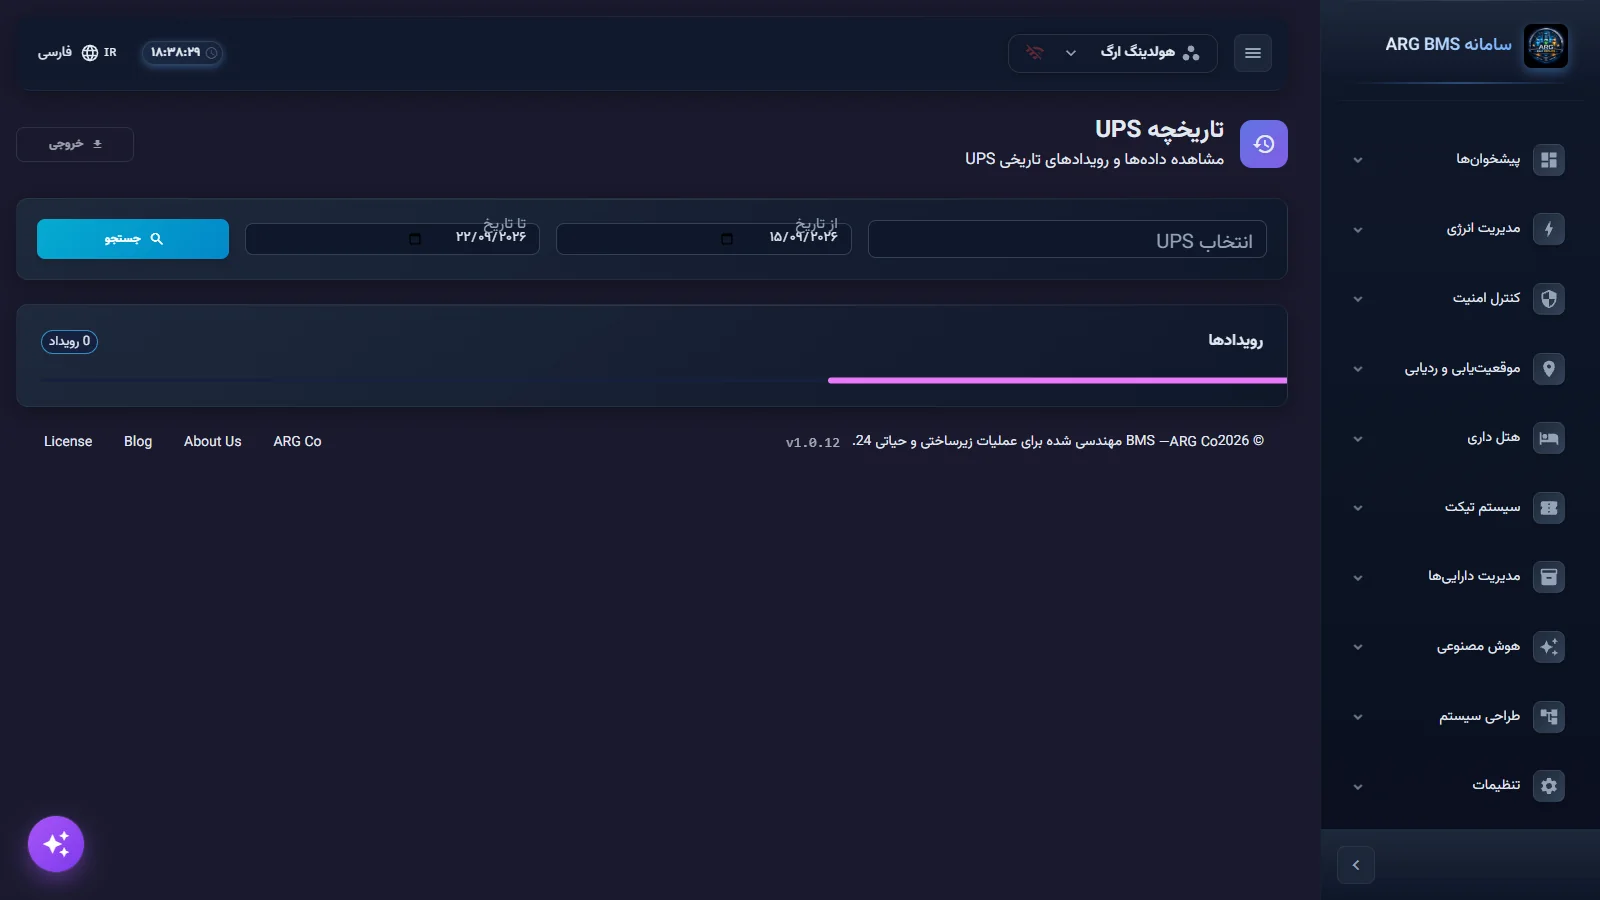
Search result · Parameter chart and the list of events in the range - Read the result. In the "Parameter chart" watch the trend of battery charge, load and input voltage, and follow the order of events in "Events" — for example, "Power outage" followed by "Low battery". If you see the message "No events found" and "No events were logged in the selected time range", none were logged in that range.
- Export. Click خروجی; a CSV file named for the UPS and the range's dates downloads, which you can open in a spreadsheet.
Which question, which tool
| Question | Tool |
|---|---|
| "Has the room temperature risen or fallen in the last half hour?" | The dashboard's live chart, keeping the page open. |
| "How many power outages last night?" | "UPS History" with yesterday's range. |
| "What was the trend of UPS load last week?" | "UPS History" and the "Parameter chart". |
| "What alerts were logged in the previous shift?" | The notification-history window in the "Alerts" tab (Lesson A3). |
Reading a UPS history result
Read the three "Parameter chart" series together, not separately: a drop in input voltage together with the start of a battery-charge decline means the UPS has switched to battery power; load staying high together with a fast charge decline means the runtime is shorter than expected. Then follow the "Events" list in time order: a "Power outage" followed by "Low battery" gives a clear picture of an incident, while "Bypass entered" and "Bypass exited" are usually tied to servicing or a momentary overload. Don't mistake a "Test" or "Maintenance" event for a real incident, and for a report take the page number and the time of events from the CSV export, since the list is paginated 20 at a time and the remaining events may be on later pages.
Common pitfalls
- The dashboard chart isn't history: if you open the page in the morning, you won't see last night's trend.
- Use the history page's "Export" for an official report, not a screenshot.
- Before refreshing the page, if the chart's trend matters to you, write down the key times and values.
- Don't mistake an empty result for an error; first check the selected date range and UPS.
Summary
- The dashboard chart fills from the moment the page opens and clears on refresh.
- A "Sample" chip means "waiting for real data".
- "UPS History" shows server data for a range of your choosing (default 7 days).
- "Export" gives a CSV of the range.
Hands-on exercise on the live demo
In the public demo ("ARG Holding" project) and observation only:
- Leave the "ARG Holding overview" dashboard open for five minutes and see how the chart fills; then refresh the page and see it start from zero.
- Open «مدیریت انرژی» ← «مدیریت UPS» ← «تاریخچه», pick a UPS and a 7-day range, and click جستجو.
- Click خروجی and open the file. If there were no events, write down the empty message.
Lesson check
Answer at least 3 of 4 correctly to pass.
- 1. From what point in time does a dashboard's chart show data?
- 2. The “Sample” chip on a chart means:
- 3. What is the default range of the “UPS History” page?
- 4. How often does the server store history?