Alerts: reading, acknowledging and responding
Read a dashboard's active alerts, judge their severity, acknowledge notifications deliberately, and filter and export the alert history for shift reports.
«پیشخوانها» ← «دیدکلی» ← ستون کناری ← زبانهٔ «هشدارها» — «پیشخوانها» ← «دیدکلی» ← ستون کناری ← زبانهٔ «هشدارها» — «Dashboards» ← «Overview» ← side column ← «Alerts» tab
An alert means a point in the facility has moved outside its normal range. The operator's job has three steps: see and prioritize, acknowledge receipt, and follow up until it returns to normal. In this version, alerts are shown in the "Alerts" tab in every dashboard's side column.
Get to know the page
Open the هشدارها (Alerts) tab in "Overview"'s side column (on mobile: the "Dashboard info" button with a red number). If there are no alerts you'll see "There are no active alerts. All systems are normal." and a "View history and reports" button.
| Element | Meaning |
|---|---|
| آلارمهای فعال (Active alarms) | List heading; next to it a clock icon ("View history") and a speaker icon. |
| بحرانی: N (Critical: N) | Number of points in error status (the most severe level). |
| هشدار: N (Warning: N) | Number of points in danger status. |
| تایید نشده است: N (Unacknowledged: N) | Blinking; notifications no one in this browser has acknowledged yet. |
| Ack All | Tooltip "Acknowledge all"; acknowledges every notification at once. |
| "Unacknowledged (N)" section | Each notification has a title, a message, an تایید دریافت (Acknowledge) button and an ✕ icon to dismiss it. |
| "Acknowledged notifications (N)" section | Notifications you have acknowledged. |
| "System alerts (N)" section | Points that are currently abnormal, most severe first; under each one, "Device:" and "Location:". |
Four point-status levels
Every monitored point in the system has one of these statuses, and this status is what builds the alert list:
| Status | Meaning for the operator | Counted in |
|---|---|---|
| Normal | The value is within its defined range; no action needed. | — |
| Caution | The value is approaching a limit; keep an eye on the point. | The "System alerts" list (no count chip) |
| Danger | The value has crossed the allowed limit; follow your organization's procedure. | The هشدار (Warning) chip |
| Error | The most severe level; needs immediate action and notifying the shift supervisor. | The بحرانی (Critical) chip |
Two kinds of entries in this tab
System alerts are the actual point status the server computes: error (critical), danger (warning) and caution. A point whose value has gone above or below its defined limit also appears here. This list automatically shrinks once the point returns to normal.
Notifications are built from each point's "alert settings" and carry messages like "Value {x} crossed the upper limit {y}", "Value {x} fell below the lower limit {y}", "Device went offline" or "Device came online". Critical- and high-priority notifications stay in the "Unacknowledged" queue until acknowledged; medium- and low-priority notifications close automatically after 60 seconds.
Step by step
- Open the tab. «پیشخوانها» ← «دیدکلی», pick the dashboard covering your area of responsibility, and click هشدارها in the side column.
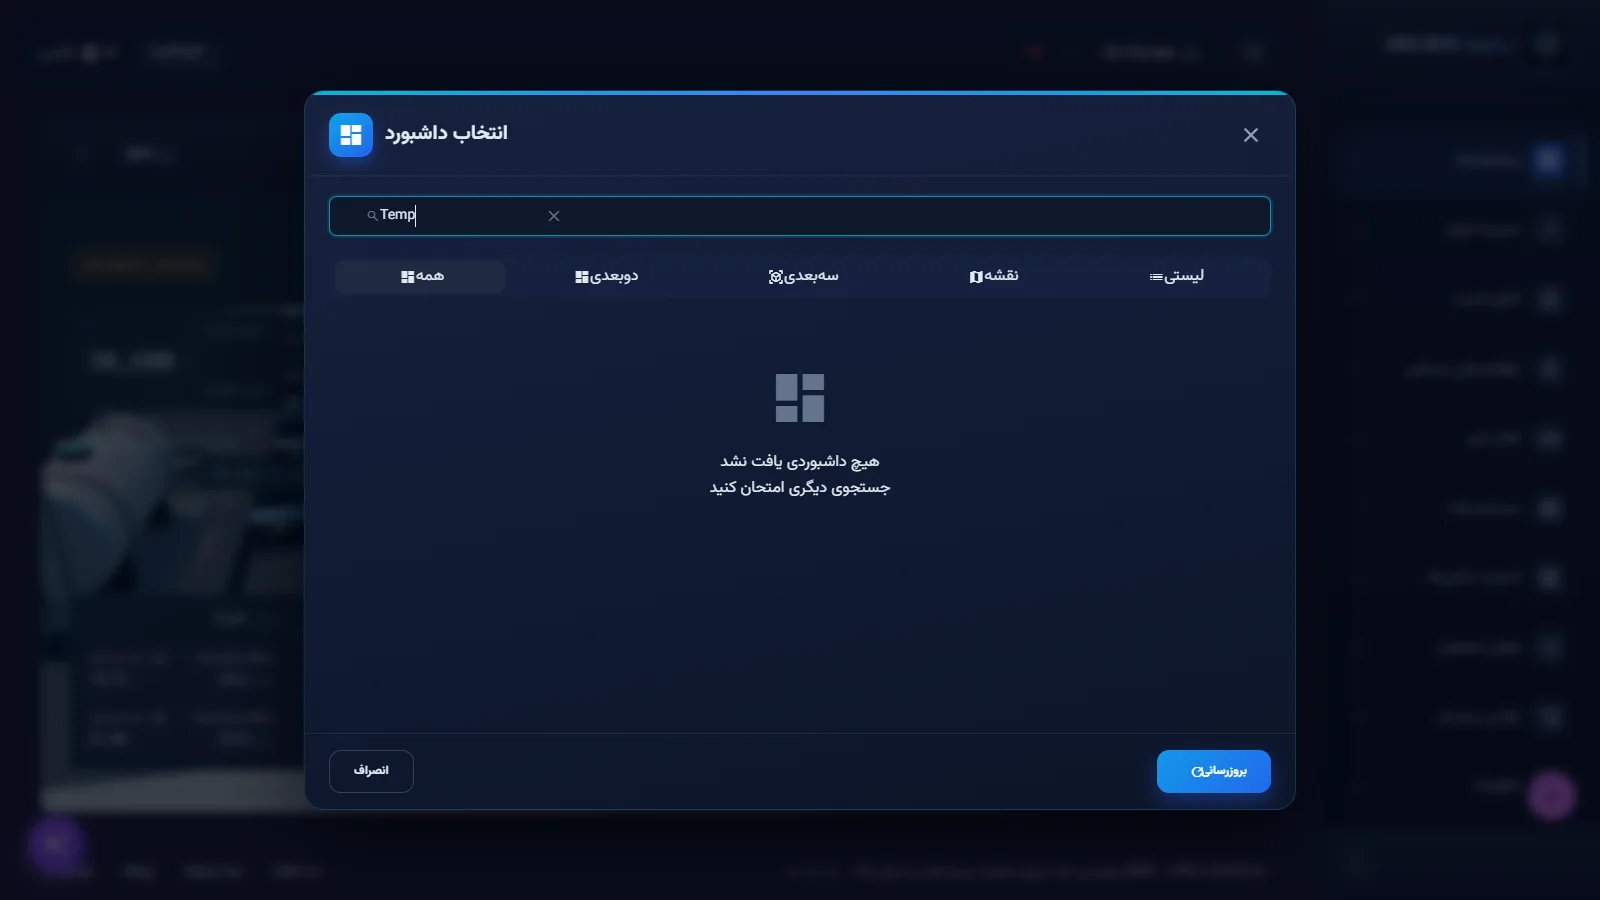
"Alerts" tab · "Critical" and "Warning" chips and the "System alerts" section with device and location - Prioritize. Read the بحرانی and هشدار chips. Go through the "System alerts" section from the top (most severe) down, and note "Device:" and "Location:" for each entry.
- Respond. Check the point's value on the dashboard or in the "ACVs" tab, follow your organization's procedure for that equipment, and notify an engineer or maintenance if needed.
- Acknowledge receipt. For each notification in the "Unacknowledged" section, after reviewing it click تایید دریافت to move it to "Acknowledged notifications". To acknowledge all at once, click Ack All; only do this once you have actually reviewed everything.
- Dismiss a notification you no longer need. Close it with the ✕ icon.
- Open the history. The clock icon ("View history") or the "View history and reports" button opens the سابقه اعلان و گزارش ها (Notification history and reports) window. Notifications are grouped into "Today", "Yesterday", "This week", "This month" and "Older".
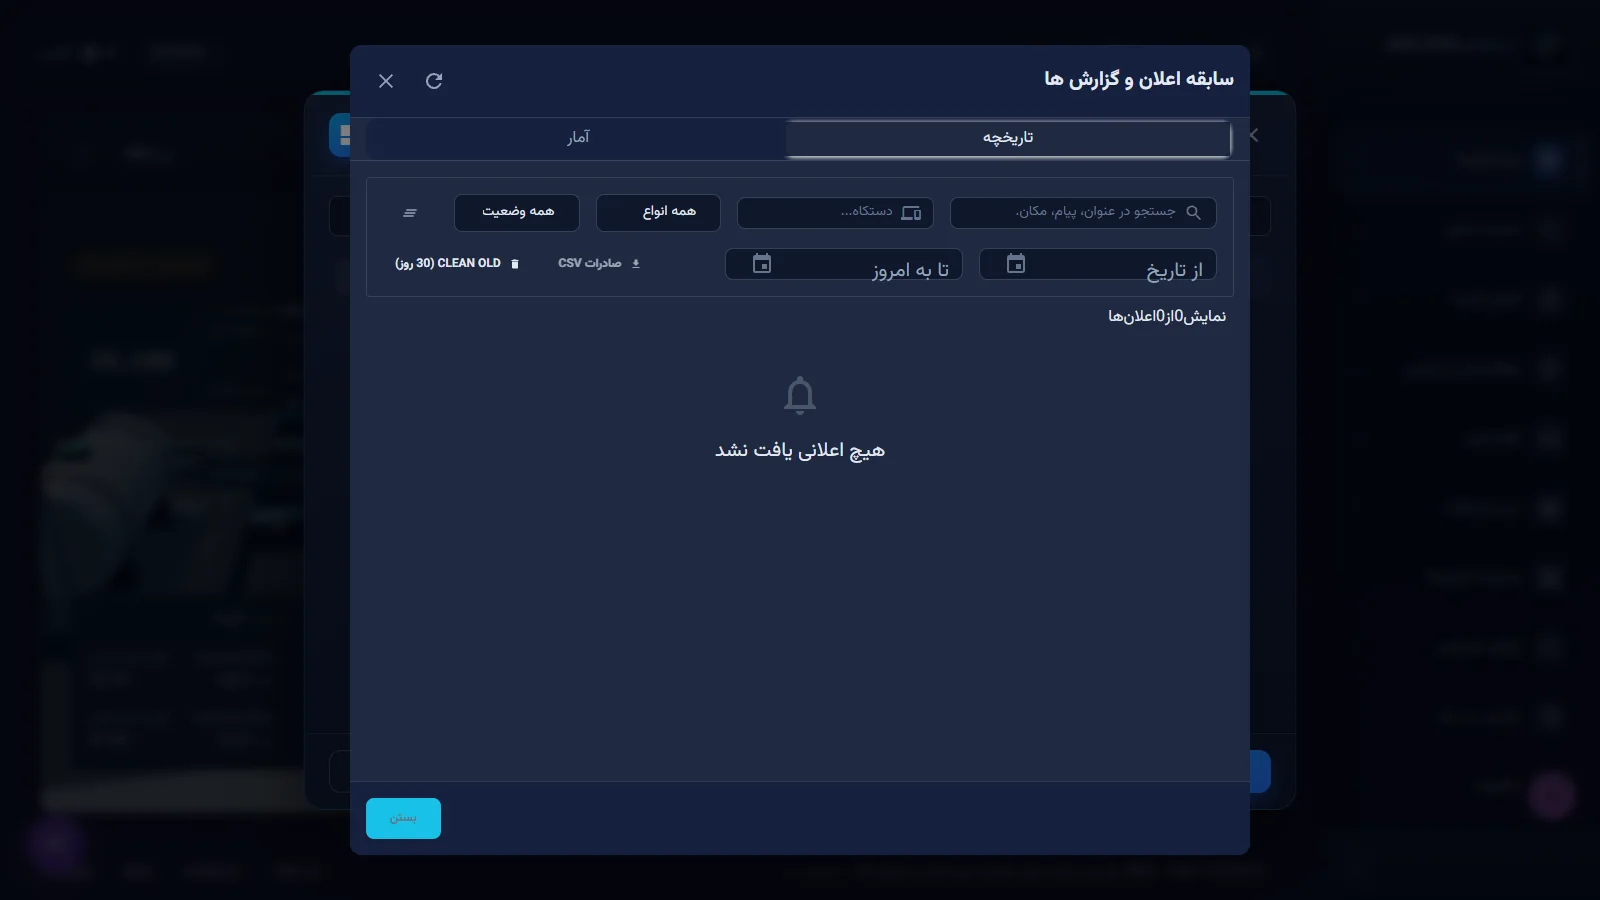
History window, "History" tab · Search, device filter, type, status and date range; "Export CSV" at the top of the list - Filter. Type in "Search title, message, location..." or set the type to بحرانی and status to تایید نشده است; narrow the range with "From date" and "To today". پاک کردن فیلترها (Clear filters) resets everything.
- Export for a shift report. Click صادرات CSV (Export CSV). The آمار (Statistics) tab shows "total notifications" broken down by type and priority.
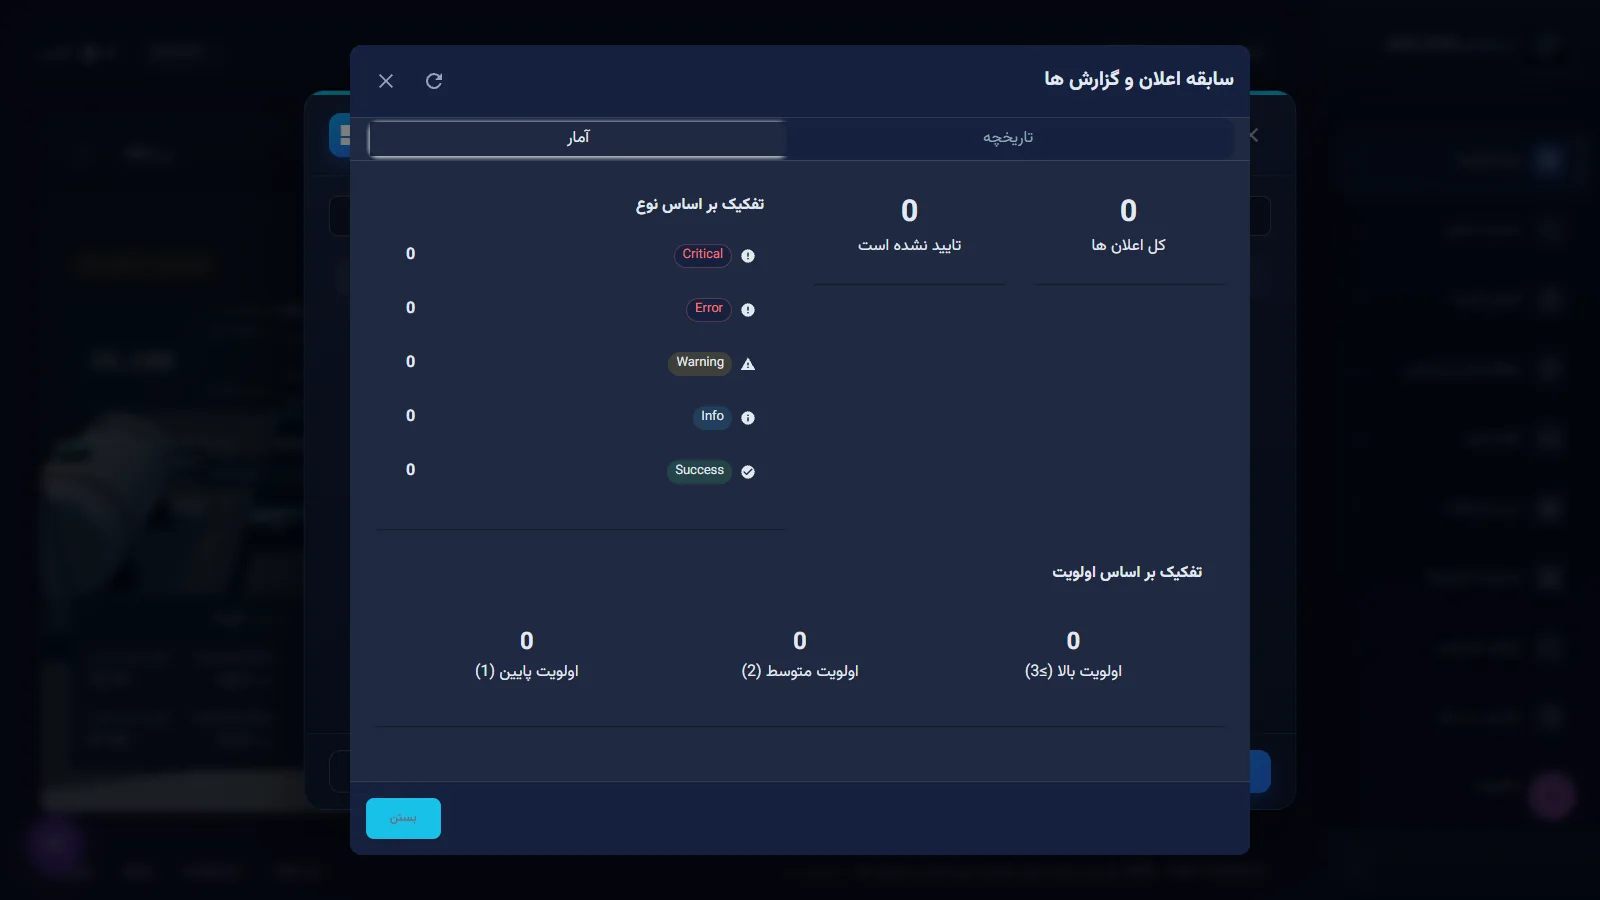
"Statistics" tab · Breakdown of notifications by type and priority
Recommended shift response routine
A fixed order both speeds up the work and prevents things from being forgotten:
- Start of shift: Open the dashboards for your area one by one and read the "Critical" and "Warning" chips on each; write down the initial list in the shift log.
- On a new alert: Check severity first, then device and location, then the point's value on the dashboard, to know whether it's getting worse or recovering.
- After acting: Click "Acknowledge" so it's known this was seen, and wait for the point to leave "System alerts".
- End of shift: Take an "Export CSV" from the history window and hand open items to the next person; since acknowledgment is recorded in your browser, the next person may see the same items as "Unacknowledged".
Common pitfalls
- "Acknowledge" means "I saw it", not "it's resolved". A point stays in "System alerts" until it returns to normal.
- This tab's list is limited to points used on the current dashboard; a different dashboard shows different alerts. Know the dashboards covering your area for full coverage.
- In the current version, this tab's speaker icon does not mute the alert sound; don't rely on it for muting.
- For a point to generate a notification, an engineer must have enabled its "alert settings"; if you expect a notification that doesn't come, report it.
- Clearing browser data also clears that browser's notification history.
Summary
- "Critical" counts points in error status and "Warning" counts points in danger status.
- "System alerts" is the actual point status and is removed automatically once normal.
- "Acknowledge" only moves the notification and is recorded in this browser.
- The history window has filters, "Export CSV" and "Statistics".
Hands-on exercise on the live demo
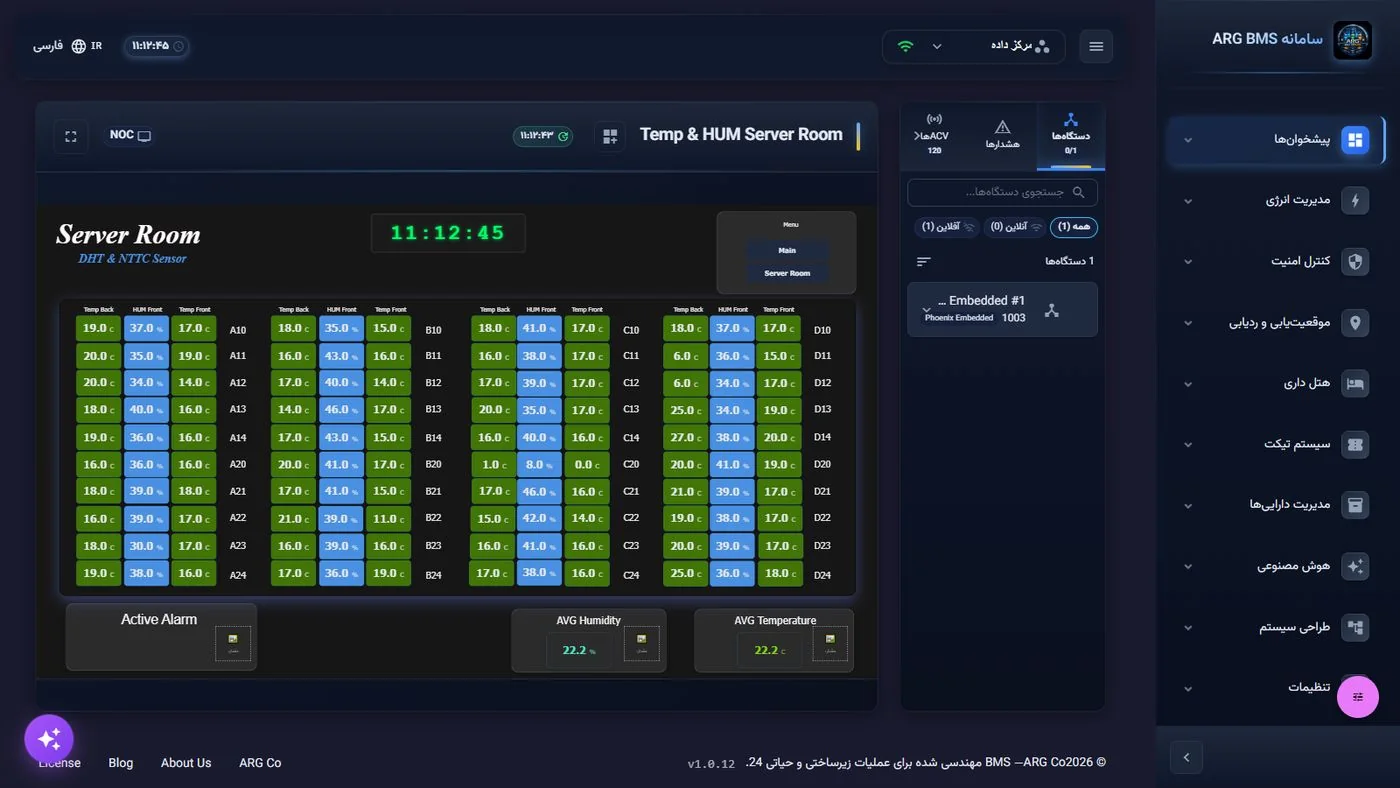
In the public demo ("ARG Holding" project) open a dashboard likely to have an alarm, such as server-room temperature and humidity.
- In the هشدارها tab, write down the "Critical" and "Warning" counts.
- Note the most severe entry in "System alerts" along with its device and location, and find its value on the dashboard.
- Open the history window, set the status filter to "Unacknowledged", and take an صادرات CSV.
- Look at the "Statistics" tab. Don't click the "Clean Old (30 days)" button.
If there is no acknowledgeable notification in the demo, just practice with the "System alerts" section and the history window.
Lesson check
Answer at least 3 of 4 correctly to pass.
- 1. What effect does “Acknowledge” have on a notification?
- 2. Which notifications stay in the “Unacknowledged” queue until acknowledged?
- 3. Which button exports the notification history?
- 4. A point in danger status is counted under which chip?