Working with 2D and 3D dashboards
Choose a dashboard and set it as default, read live values and device status, move around in a 3D scene, and display the dashboard in full screen.
«پیشخوانها» ← «دیدکلی» و «پیشخوانها» ← «داشبوردهای لیستی» — «پیشخوانها» ← «دیدکلی» و «پیشخوانها» ← «داشبوردهای لیستی» — «Dashboards» ← «Overview» and «Dashboards» ← «List dashboards»
The dashboard is the operator's window into the facility. On "Overview" a dashboard is shown in the center of the page: 2D (process schematics, value tables, charts) or 3D (a server-room, facility, or site scene). In this lesson you'll learn to switch dashboards, read them, and move around in a 3D scene.
Get to know the page
The «پیشخوانها» ← «دیدکلی» (Dashboards ← Overview) page has two parts: the dashboard card and the dashboard's side column.
| Element | Purpose |
|---|---|
| Dashboard title | The name of the dashboard currently shown. |
| انتخاب داشبورد (Select dashboard) | Small button next to the title; opens the dashboard-selection window. |
| Green clock chip | Time of the last value update. |
| تمام صفحه (Full screen) | The dashboard takes over the whole display; exit with the same button or the Esc key. |
| Side column | Tabs for دستگاهها (Devices) (with an online/total count), هشدارها (Alerts) and ACVها (ACVs). |
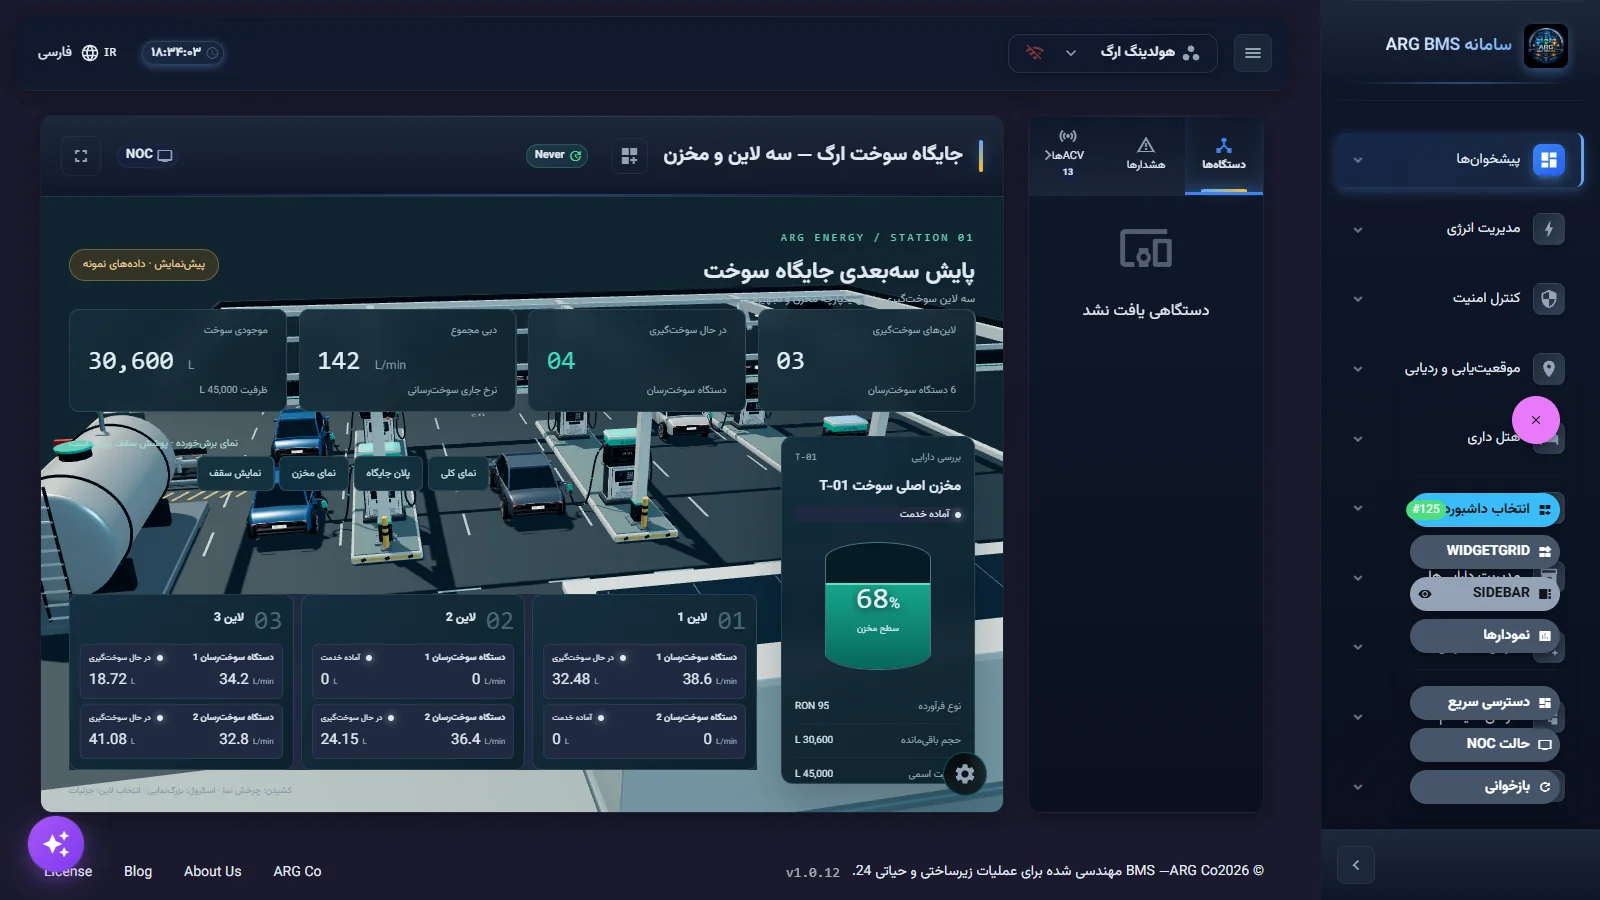
| کنترل های داشبورد (Dashboard controls) | Round pink button at the bottom of the page with a menu for "Select dashboard", "WidgetGrid", "Sidebar", "Charts", "Quick access", "NOC mode" and "Refresh". |
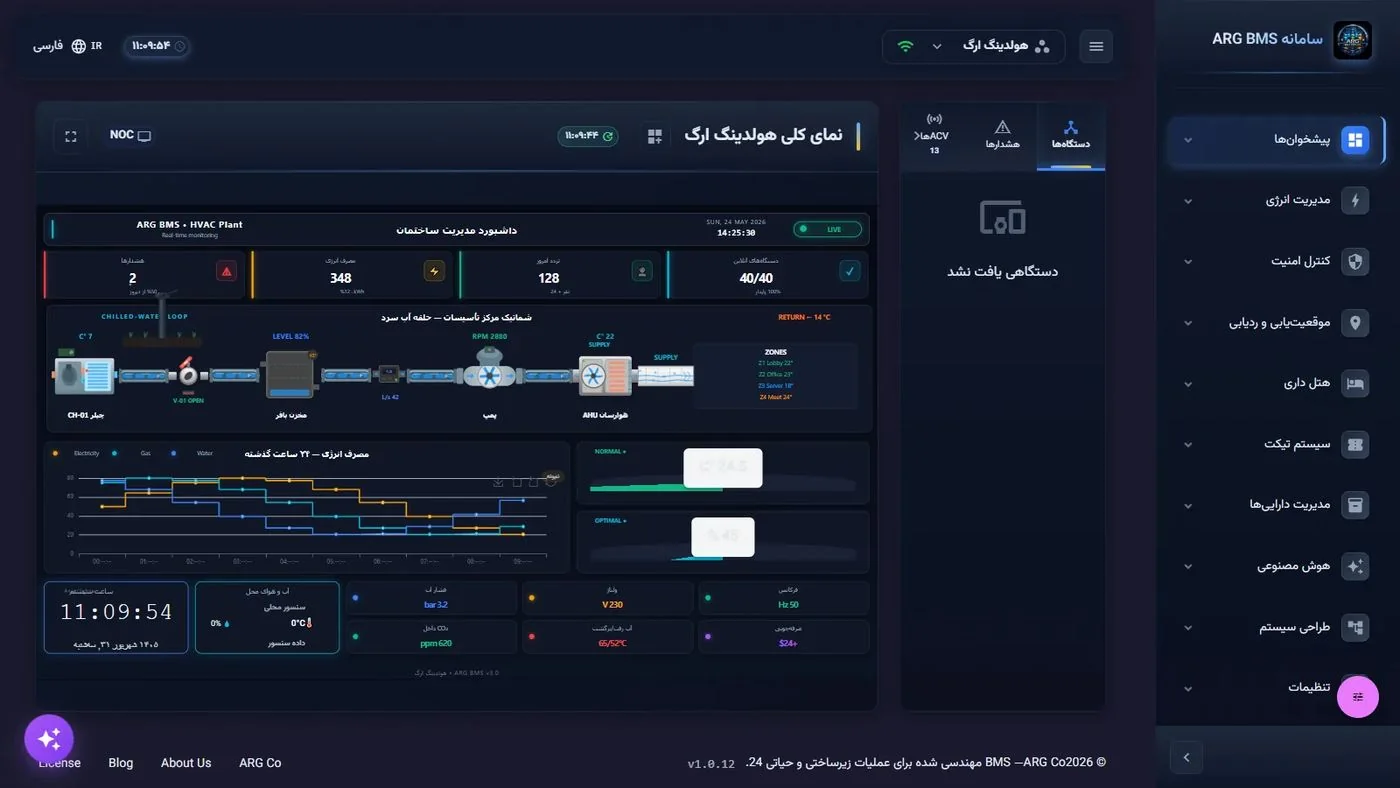
The "Devices" tab has a "Search devices…" box, the filters همه (All), آنلاین (Online), آفلاین (Offline) and آلارم (Alarm), and sorting by type, serial number or status. If the dashboard isn't connected to any device you'll see "No devices found". The "ACVs" tab lists the dashboard's points with the filters "All", "Sensors", "Controls" and "Alarms".
Step by step
- Open "Overview". From the sidebar, «پیشخوانها» ← «دیدکلی». The default dashboard opens, or if none is set, the last one you viewed.
- Pick a different dashboard. Click انتخاب داشبورد next to the title. In the window, pick a type tab (همه, دوبعدی (2D), سهبعدی (3D), نقشه (Map), لیستی (List)) or type part of the name in "Search dashboards…". Each card shows the type and the number of "elements"; the current dashboard has an "Active" chip. Click a card to open it.
"Select dashboard" window · Type tabs, search, and cards with "Active" and "Default" chips - Set your default dashboard. In the same window, click تنظیم به عنوان پیشفرض (Set as default) on the card you want; the message "New default dashboard selected…" appears. Then click تنظیم پیشفرض (Set default). From now on, "Overview" opens with this dashboard in this same browser.
- Read the values. Values update live, and the time of the last update is in the green chip. The color coding of each tile is set by whoever designed that dashboard, so ask that designer or an engineer what the colors mean. Always check the connection icon's color in the header before drawing any conclusion.
- Find offline devices. In the side column open the دستگاهها tab and click the آفلاین filter. Expand a row to see a device's details ("Location", "Model", "Firmware").
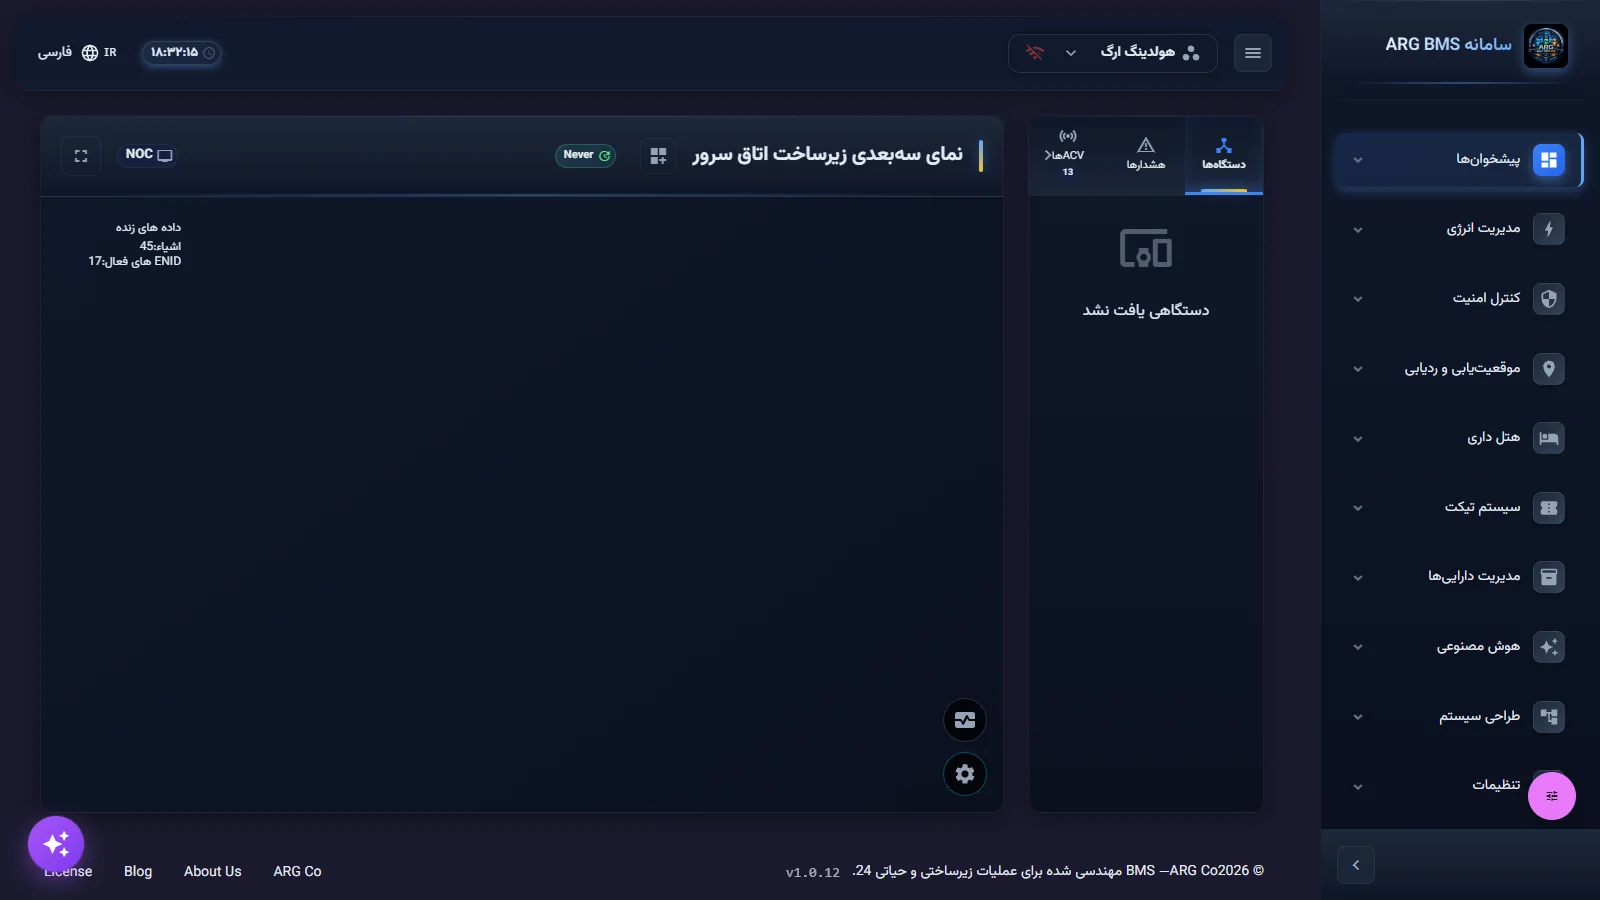
- Open a 3D scene. From the selection window, click the سهبعدی tab and open a scene. The داده های زنده (Live data) box in the top corner shows "Objects:", "Active ENIDs:" and, if there's an alarm, a red "Alarms:" row.
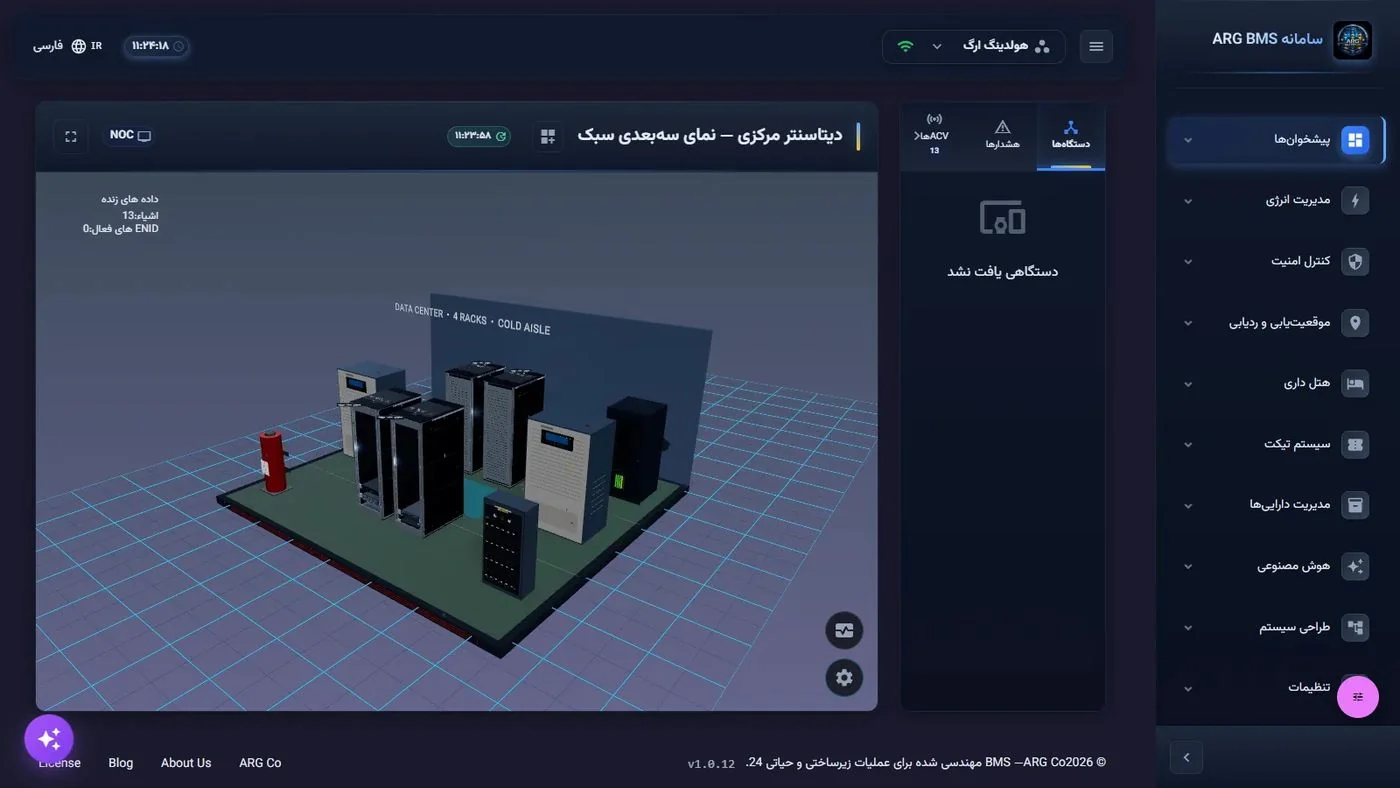
3D scene · "Live data" box at the top; gear button and "DCIM visualization" button at the bottom of the scene - Move around the scene. Drag with the left mouse button to rotate, use the scroll wheel to zoom, and drag with the right mouse button to pan. Hover over an object to see its name.
- Use the preset views. Click the کنترل های صحنه (Scene controls) gear button. In the "Scene control" panel, the دوربین (Camera) section has the views "Perspective", "Top", "Front", "Back", "Left" and "Right". To go back, click بازگشت به دوربین اولیه (Return to initial camera).
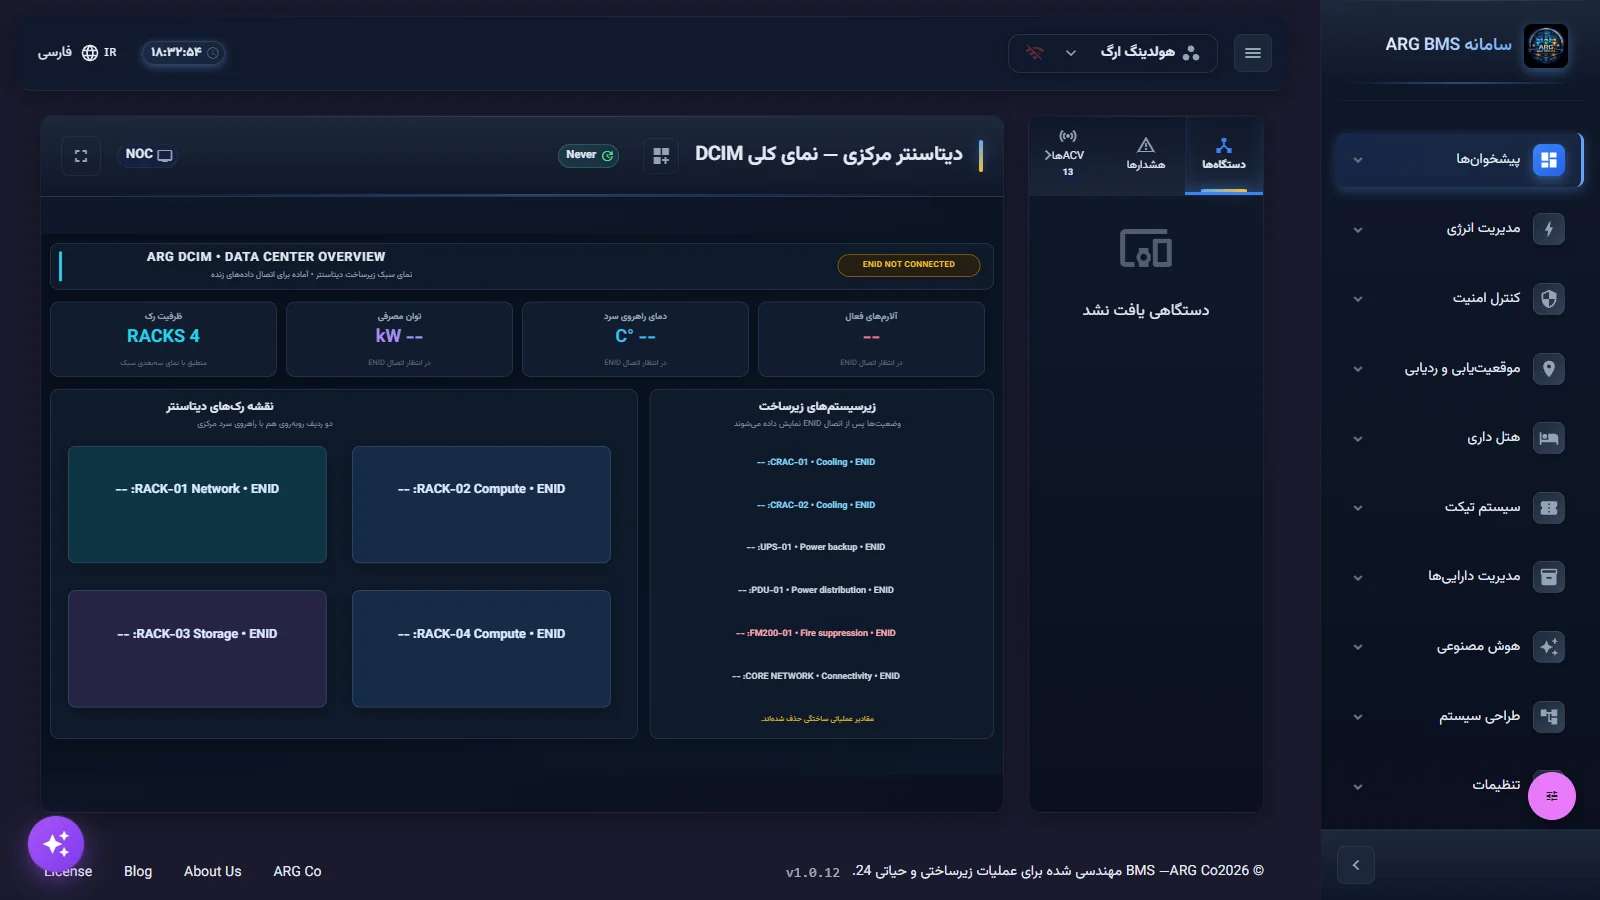
"Scene control" panel · "Camera" section with preset views and "Return to initial camera" - Use "DCIM visualization" in a data center. The تجسم DCIM (DCIM visualization) button has the modes "Health status", "X-ray mode", "Thermal overlay", "Data labels", "Rack capacity", "Color by attribute" and "Cable paths". "Thermal overlay" is useful for finding hot spots in racks.
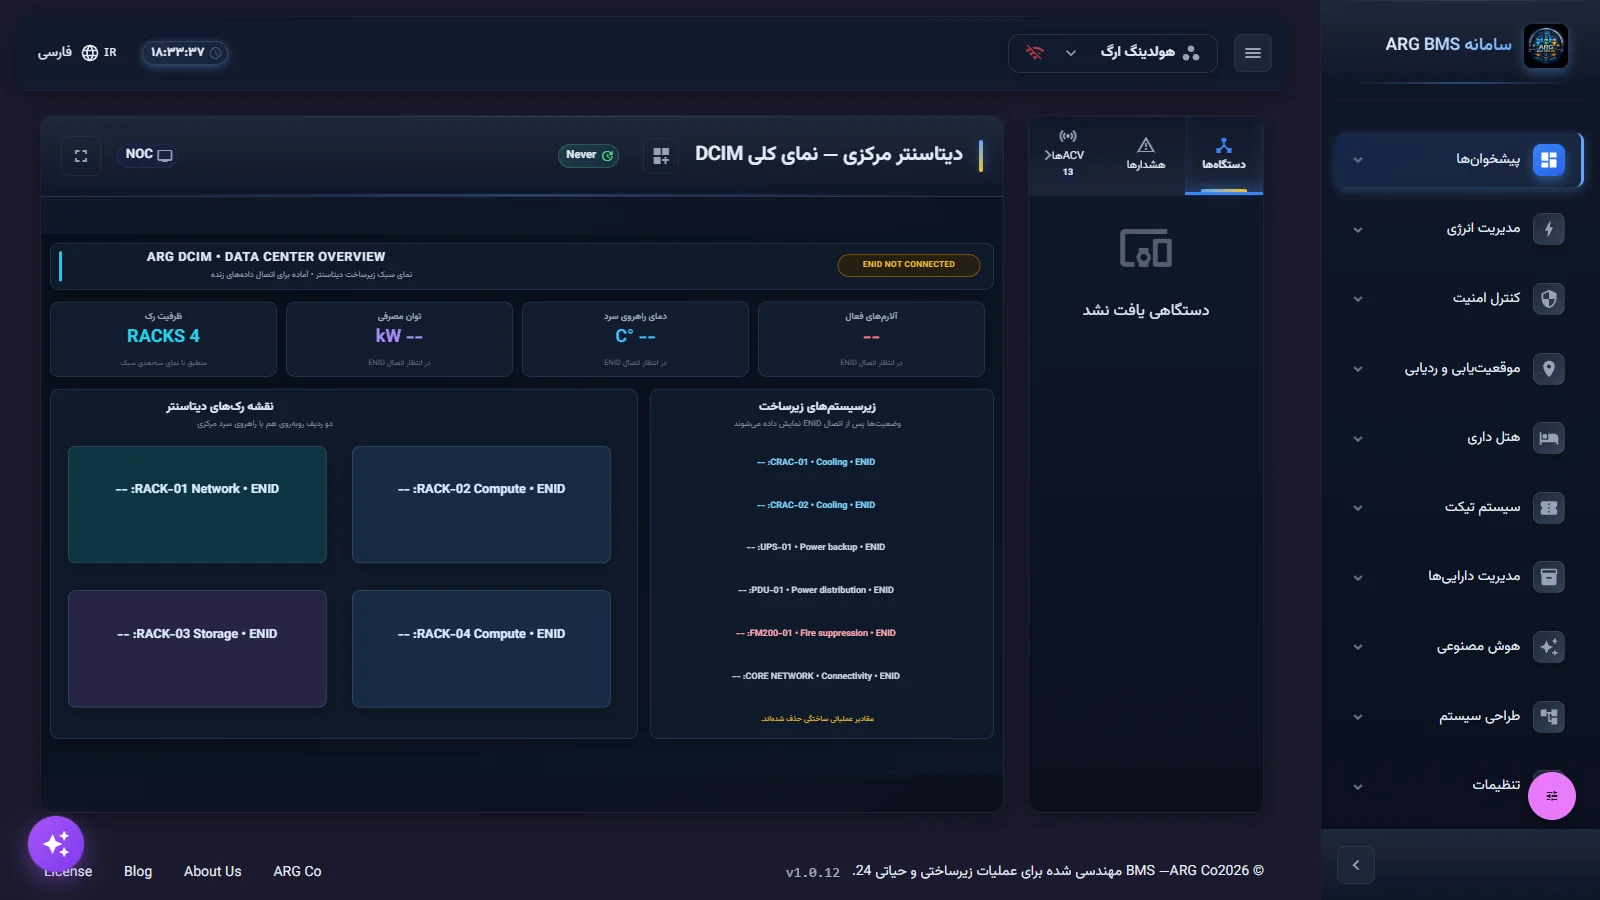
"DCIM visualization" ← "Thermal overlay" · Temperature coloring of racks on the scene - Know what clicking a 3D object does. If the designer defined a "command" for an object, clicking it sends a command and first asks for your password (Lesson A4). If it has a dashboard link, you're taken to that dashboard. So don't click objects without a reason.
- Go full screen. For a video wall or to see detail, click تمام صفحه and exit with Esc. The 2D canvas resizes automatically with the window, so use full screen instead of the browser's zoom.
- Try the list dashboard. «پیشخوانها» ← «داشبوردهای لیستی» (Dashboards ← List dashboards). In the "Select display type" card pick one of "Project structure" (organization, building, floor, space), "Control-variable type" or "My lists" and drill down from organization to space.
Common pitfalls
- The default dashboard is per browser; it has to be set again on a different computer.
- The "NOC" chip in the current version only changes the chip's own appearance; use "Full screen" for a video wall.
- Clicking a device row in the "Devices" tab does not open a details page; expand the row instead to see details.
- In the current version, the status-indicator color on 3D scene objects is not an authoritative reference; read point status from the "Alerts" and "ACVs" tabs.
- A "Sample" chip on a chart means "waiting for real data"; the chart's shape is not yet real.
- If you see "No 3D scene available" in a 3D scene, no scene has been designed for this dashboard yet.
Summary
- Find a dashboard with "Select dashboard" and the type tabs.
- "Set default" only applies to this browser.
- In a 3D scene: gear ← "Camera" for preset views; "DCIM visualization" for data centers.
- Clicking an object with a command sends a command; click deliberately.
- Use "Full screen" for a video wall.
Hands-on exercise on the live demo
In the public demo ("ARG Holding" project), observation only:
- Open انتخاب داشبورد, click the سهبعدی tab and open a data-center scene.
- Try the بالا (Top) view from the gear menu, then بازگشت به دوربین اولیه.
- Turn تجسم DCIM ← "Thermal overlay" on and off again.
- Set a 2D dashboard as default, refresh the page, and see that the same one opens. This choice only affects your own browser and does not change the demo data.
- Click تمام صفحه and exit with Esc. Don't click on scene objects that carry a command.
Lesson check
Answer at least 3 of 4 correctly to pass.
- 1. Where is the default dashboard kept?
- 2. How do you see the top view of a 3D scene?
- 3. What are the tabs of the “Select dashboard” window?
- 4. In the 3D scene's “Live data” box, what does the red row show?