Reports and the project execution path
Know which export you can actually get today and from where, and use the six-step project methodology — with the output, roles and realistic timeline of each step — for planning.
«ساختار» ← «دستگاهها» · «مدیریت داراییها» ← «فهرست داراییها» · «پیشخوانها» ← «دیدکلی» (تاریخچهٔ اعلانها) — «ساختار» ← «دستگاهها» · «مدیریت داراییها» ← «فهرست داراییها» · «پیشخوانها» ← «دیدکلی» (تاریخچهٔ اعلانها) — «Structure» ← «Devices» · «Asset management» ← «Asset list» · «Dashboards» ← «Overview» (notification history)
This lesson has two parts: first, an honest list of the exports that actually produce a file today, and second, the project methodology in six steps with a defined output for each. A project manager and a client-side representative can use these two parts alone to set the schedule, acceptance criteria and reporting expectations.
Part one — what export you can actually get today
| Where | Export format |
|---|---|
| Device list (Structure group) | CSV, compatible with Persian Excel |
| Notification history on the dashboard | CSV |
| Water history and UPS history | CSV |
| فهرست داراییها (Asset list) ← دانلود EXCEL (Download Excel) | CSV |
| Dashboard designer / My dashboards | A dashboard package for moving to another project |
| 3D designer | A scene file and a PNG image |
| Project settings | A configuration backup |
| Access-control and parking reports | Browser printing |
Step by step — getting an export
- Get the equipment list. On the devices page (Structure group), first narrow the scope with the filters, then click the button with the tooltip خروجی (Export); only the filtered rows are exported. To export several selected rows, use خروجی گرفتن از موارد انتخابی (Export selected items) from the bulk-actions menu.
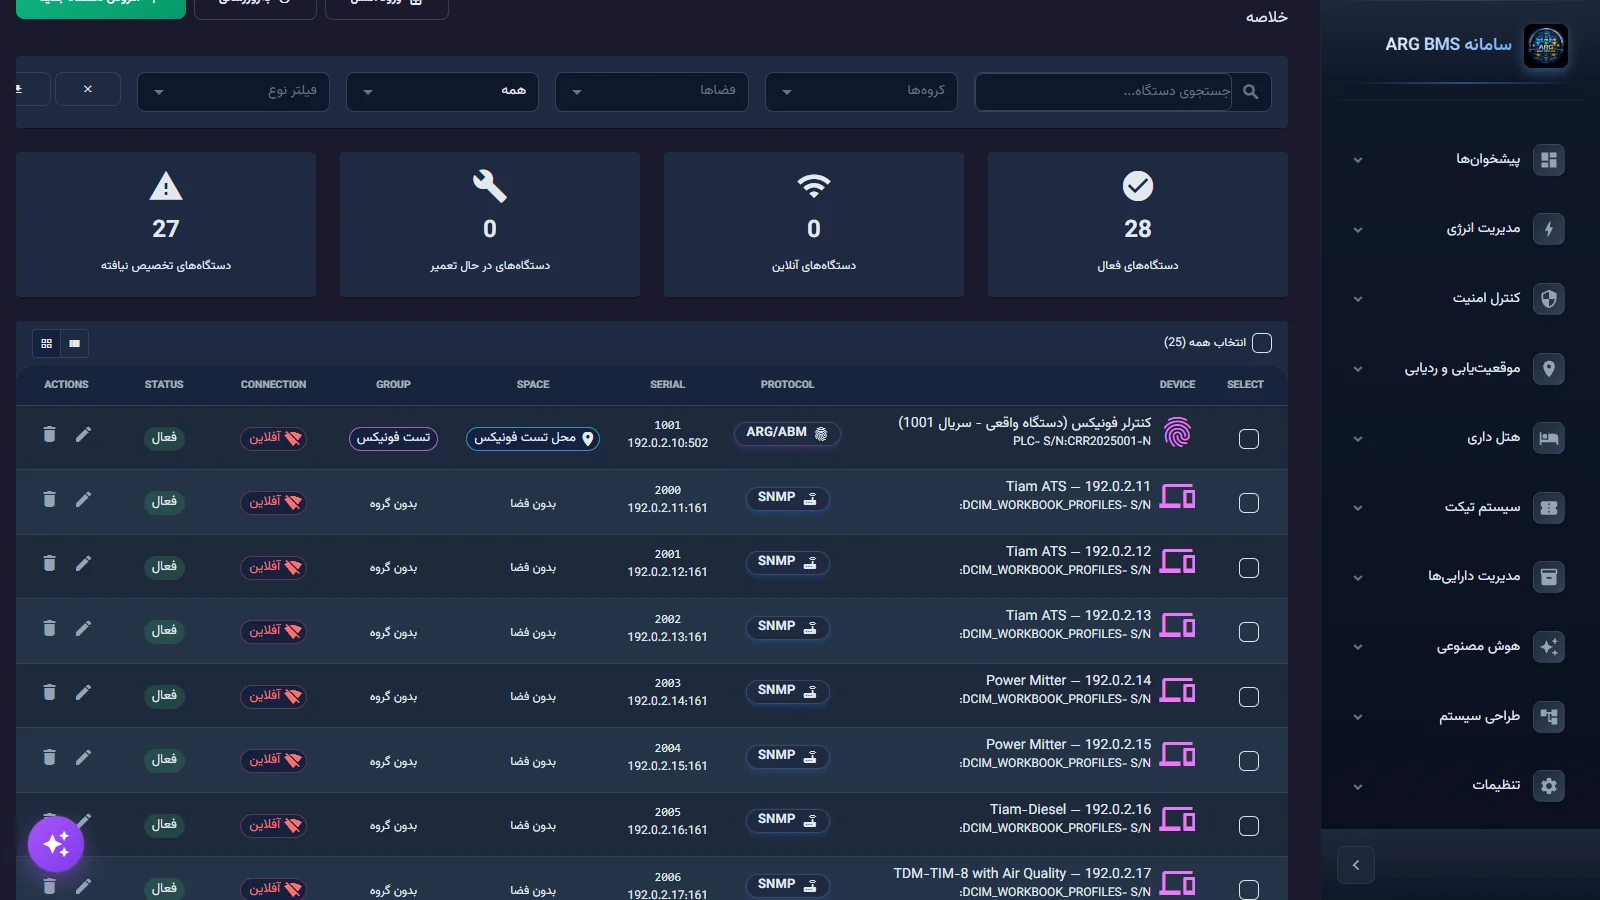
Device list · Filter bar and the export button at the top of the table; this same list is the basis for the project's equipment statement - Get the asset list. «مدیریت داراییها» ← «فهرست داراییها» ← دانلود EXCEL. The file is CSV; when opening it in Excel, choose UTF-8 encoding so Persian characters display correctly.
- Get the alert history. On دیدکلی (Overview), open the هشدارها (Alerts) tab in the sidebar and click the مشاهده تاریخچه (View history) icon; the سابقه اعلان و گزارش ها (Notification history and reports) window opens, and the صادرات CSV (Export CSV) button gives the file. This export is enough for a monthly report of "how many alerts, what type, when".
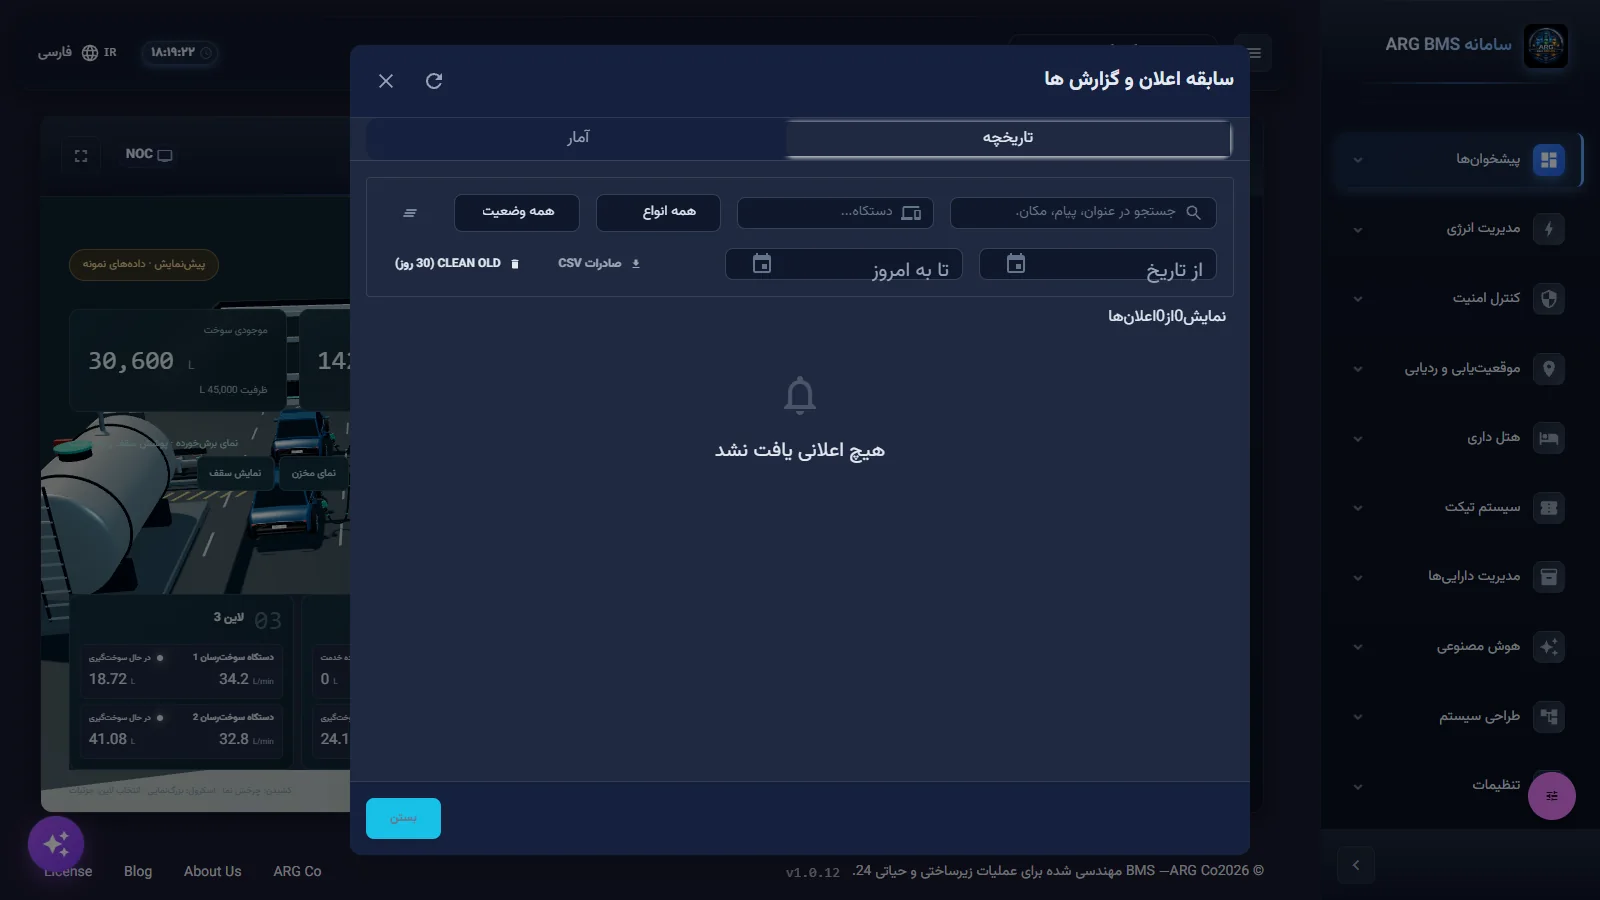
Notification history and reports · The notification-history window with the "Export CSV" button - Move a dashboard to another project. Use the package export in the dashboard designer; this is exactly the path that makes a standard executive view repeatable across several sites.
Part two — the project execution methodology, in six steps
A sample project with 200 to 400 pieces of equipment reaches production in six steps, usually in 4 to 8 weeks. The important point for planning: most of the time goes into network access and validating points with the client's facilities team, not into the software.
| Step | Activities | Step output |
|---|---|---|
| 1 · Discovery | Site visit, equipment and protocol inventory, floor plans, network access, defining roles and alert recipients | Equipment list with protocol and address; network map |
| 2 · Deployment | Server install (Windows, Linux, Docker or cloud), database, security certificate, companion services, backups | The system up and reachable, with a product profile |
| 3 · Structure and equipment | Importing structure from Excel, creating equipment from the catalog, custom mappings, testing each device's protocol, defining each point's limits and alerts | Every point live and green in monitoring |
| 4 · Dashboards and twin | 2D dashboards from templates, 3D scenes from the library or the client's model, an executive overview, a map dashboard | A dashboard set broken down by role |
| 5 · Logic and alerts | Rules, scenarios and state machines; testing in the logic lab with a simulator; notification channels and an escalation policy | Automation active and tested |
| 6 · Training and handover | Training operators and engineers, project documentation, a joint monitoring period, final handover and support | Formal go-live |
Project roles: project manager (schedule and delivery), automation engineer (protocols and points), dashboard designer (2D and 3D), logic engineer (rules and scenarios), and a client-side representative (access, validation, acceptance). The only role with no substitute is the client-side representative; delays in this role translate directly into delays in steps 1 and 3.
Service options: on-premises or cloud deployment with a dedicated domain; periodic monitoring, support and zero-downtime updates; developing a custom driver or twin type for specific equipment; integrating with the organization's existing systems through the API.
Capacity — for estimating project size
Measured on the current version of the system and an ordinary server (6 virtual cores, 16 GB memory) with 3,456 points from a data center:
| Update interval per point | Target load (values per second) | Achieved load | Lost |
|---|---|---|---|
| 1 second | 3,456 | 3,623 | 0 |
| 250 ms | 13,824 | 13,941 | 0 |
| 100 ms | 34,560 | 34,679 | 0 |
| 50 ms | 69,120 | 69,165 | 0 |
| 20 ms | 172,800 | 117,776 (test hardware ceiling) | 0 — with latest-value coalescing |
The takeaway for planning: on an ordinary server, the publishing engine delivers roughly 70,000 updates per second to every connected user with zero loss, and at higher load (up to roughly 120,000 per second) it still delivers each point's freshest state through "latest-value coalescing". The full processing path — computing, limits, logic and storage — was measured at roughly 2,500 value changes per second for a single measurement node in this same test; that's equivalent to monitoring tens of thousands of points with change-based reporting.
Common pitfalls
- In planning, the 4-to-8-week window is for a 200-to-400-equipment project, and the usual bottleneck is network access and point validation, not software installation.
- Set the end-of-step-3 criterion as "every point live and green in monitoring" and the end-of-step-5 criterion as "automation active and tested in the logic lab"; these two sentences are more precise than most handover minutes.
- Schedule the joint monitoring period before signing off on handover; most limit and alert corrections are found during this period.
- The message "File downloaded" on some history pages doesn't mean the file was actually received; check the downloads folder for the file.
- Agree on the export format with the finance and maintenance teams beforehand; CSV is available today, and PDF requires connecting the organization's reporting tool to the API.
Summary
- Today's real exports: devices, assets, notification history, water and UPS history (all CSV), plus a dashboard package, a scene file and a configuration backup.
- PDF export is not produced in the current version.
- Project execution: six steps with a defined output each; 4 to 8 weeks for 200 to 400 pieces of equipment.
- The client-side representative's role determines the schedule: access, validation, acceptance.
- For capacity estimation: roughly 70,000 updates per second with zero loss on an ordinary server, and roughly 2,500 value changes per second on the full processing path of a single node.
Hands-on exercise on the live demo
A combined exercise on the public demo and on paper. In the demo only export and look; don't save or delete anything.
- Export a CSV from the devices page and also click فهرست داراییها (EXCEL) from دانلود EXCEL ; open both files in Excel and write down which one displays Persian characters correctly without adjusting the encoding.
- On دیدکلی open the سابقه اعلان و گزارش ها window and write down which of its columns are useful for a monthly board report.
- For a hypothetical building with 300 pieces of equipment, fill in the six-step table with a start and end date for each step and the name of the responsible role, and compare the total span with the 4-to-8-week range.
- List three periodic reports your organization actually needs, and next to each write down which export it's built from today, or which integration it needs.
Lesson check
Answer at least 3 of 4 correctly to pass.
- 1. What is the output of the “Structure and equipment” step in the project methodology?
- 2. How long does a sample project with 200 to 400 pieces of equipment usually take to reach production?
- 3. Which project role is responsible for “access, validation, acceptance”?
- 4. Which export actually produces a real file in the current version?