Energy, tariffs and cost
Get to know the six “Energy monitoring” pages, know what each card and chart measures, and know which number in the current version can be cited and which section still shows no data.
«مدیریت انرژی» ← «پایش انرژی» ← «پایش لحظهای» / «مدیریت کنتورها» / «تحلیل مصرف» / «مدیریت هزینه» / «کنترل دیماند» / «بهینهسازی» — «مدیریت انرژی» ← «پایش انرژی» ← «پایش لحظهای» / «مدیریت کنتورها» / «تحلیل مصرف» / «مدیریت هزینه» / «کنترل دیماند» / «بهینهسازی» — «Energy management» ← «Energy monitoring» ← «Live monitoring» / «Meter management» / «Consumption analysis» / «Cost management» / «Demand control» / «Optimization»
This lesson is an executive tour, not a number-reading exercise: we review six energy pages so you know what each one measures, what decision it supports, and which section, in the current version, actually yields a number. In the demo project most cards on these pages show "—"; the reliable number comes from the "Meter status" table.
Get to know the page
| Page | What it measures | Management decision |
|---|---|---|
| پایش لحظهای (Live monitoring) | Total consumption, peak demand, ambient temperature, system efficiency and the meter-status table | Whether metering is functioning and which meter has dropped out |
| مدیریت کنتورها (Meter management) | Physical meters, virtual meters, grouping and calibration | Measurement coverage and reading validity |
| تحلیل مصرف (Consumption analysis) | Consumption trend over a period, daily average, peak, each unit's share | Where energy is used and where there's a chance to cut it |
| مدیریت هزینه (Cost management) | Cost for the current month, average rate, cost breakdown by tariff, invoices | Financial impact of consumption and shifting load between hours |
| کنترل دیماند (Demand control) | Current demand against the allowed limit and a 24-hour chart | Avoiding a penalty for exceeding contracted demand |
| بهینهسازی (Optimization) | Optimization score, savings, consumption reduction and CO2 reduction, list of opportunities | Prioritizing consumption-reduction actions |
Step by step
- Start with live monitoring. «مدیریت انرژی» ← «پایش انرژی» ← «پایش لحظهای» (Energy management ← Energy monitoring ← Live monitoring). The بروزرسانی خودکار: 5 ثانیه (Auto-refresh: 5 seconds) button is on by default; click it once during a presentation so the page holds still — it changes to بروزرسانی متوقف (Refresh stopped).
- Read the "Meter status" table. The columns are نام کنتور (Meter name), مصرف لحظهای (Instantaneous consumption), وضعیت (Status) (فعال (Active) or غیرفعال (Inactive)) and آخرین بروزرسانی (Last update). The management rule is simple: any meter that's "Inactive" or has a stale timestamp means that unit's energy report will be incomplete.

Live energy monitoring · "Meter status" table: name, instantaneous consumption, status and last-update time - See measurement coverage in "Meter management". It has four tabs: کنتورهای فیزیکی (Physical meters), کنتورهای مجازی (Virtual meters) (a meter built from a formula over several sources), گروهبندی کنتورها (Meter grouping) and کالیبراسیون (Calibration) (with the last and next calibration dates and accuracy). The کنتورهای برق (Electricity meters), کنتورهای آب (Water meters) and کنتورهای گاز (Gas meters) cards show the active and inactive count for each category.
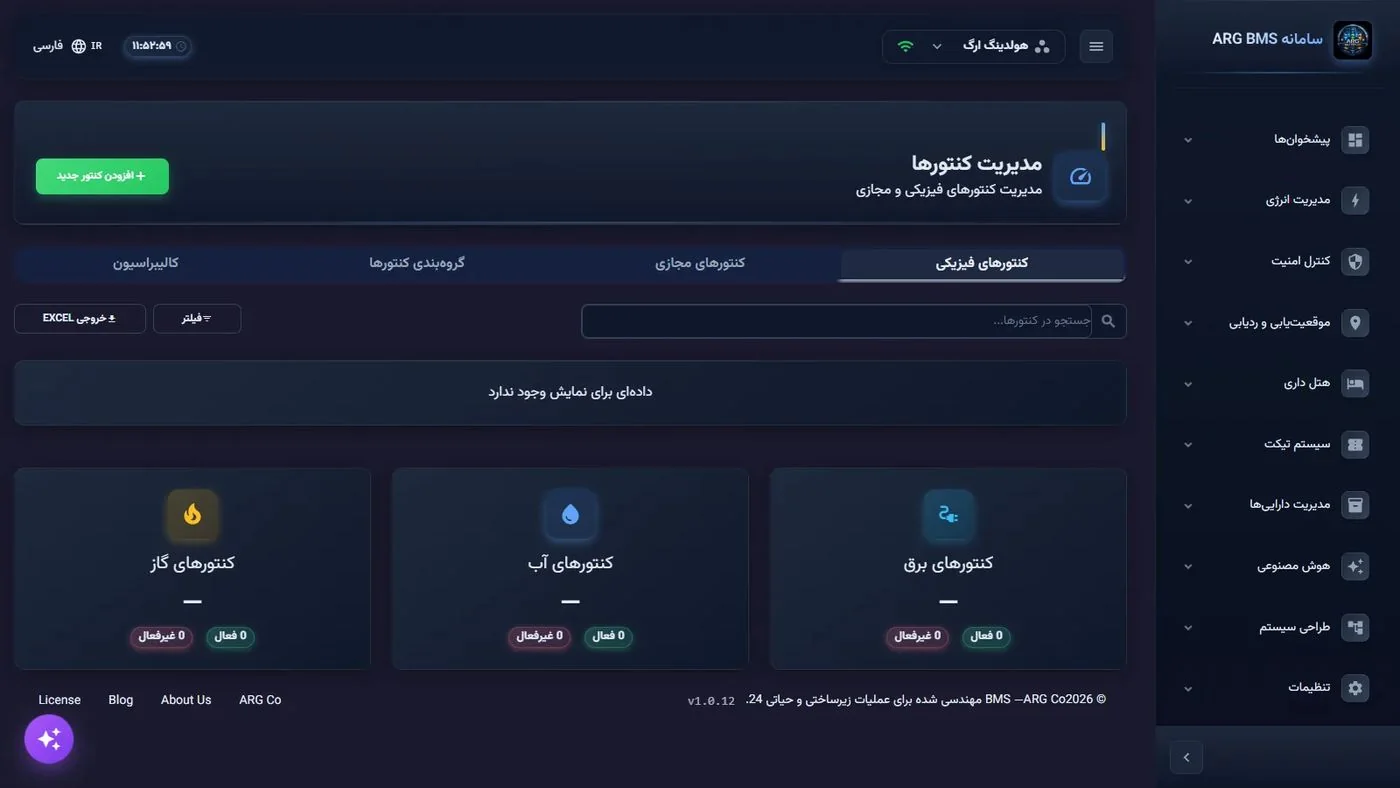
Meter management · Four tabs, electricity/water/gas cards with active and inactive chips; no meter is registered in the demo project - Change the period in "Consumption analysis". The period filter has four settings: روزانه (Daily), هفتگی (Weekly), ماهانه (Monthly) (default) and سالانه (Yearly); the cards show مصرف کل (Total consumption), میانگین روزانه (Daily average), پیک مصرف (Peak consumption) and بازده انرژی (Energy efficiency), and the charts show the trend and each unit's share.
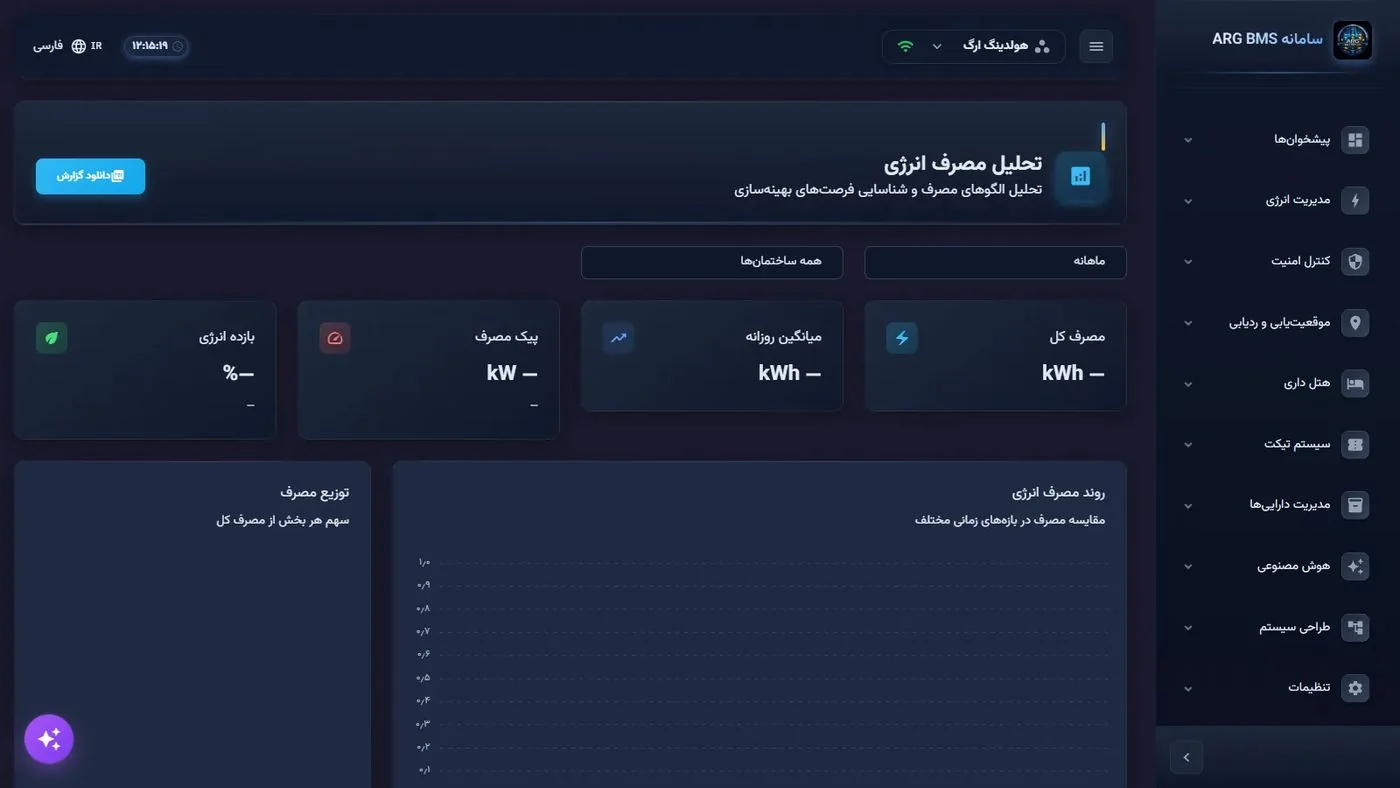
Energy consumption analysis · Period and building filters at the top of the page; four indicator cards and two trend/distribution charts Note: In the current version the همه ساختمانها (All buildings) filter has no effect on the data, and the trend chart's series label always reads "Monthly consumption (kWh)", even when the "Weekly" period is selected. - Read "Cost management" as the financial language of energy. The هزینه ماه جاری (Current month's cost) card with a "forecast through month end" chip, the میانگین نرخ (Average rate) card, the توزیع هزینه بر اساس تعرفه (Cost breakdown by tariff) section with three boxes — کمباری (Off-peak), میانباری (Mid-peak) and پیک (Peak) — the روند هزینه و مصرف (Cost and consumption trend) chart, and the صورتحسابهای اخیر (Recent invoices) table. This page's management message is one sentence: cost isn't just a function of "how much", it's also a function of "what time".
Note: In the current version there is no page in the interface for defining the tariff table; tariff values are kept on the server. Also, the "current month's cost" card's figure shouldn't be quoted in a management report until the currency unit is validated.
- Understand "Demand control"; here the number is tied to a penalty. The وضعیت دیماند لحظهای (Instantaneous demand status) panel has three figures: دیماند فعلی (Current demand), حد مجاز (Allowed limit) and وضعیت (Status). The thresholds are clear: below 75% of the limit is "Normal", from 75% is "Caution", from 90% is "Warning", and from 100% is "Critical". The تنظیم حد دیماند (Set demand limit) panel has a slider from 200 to 500 kW in steps of 10, defaulting to 350; until you make a change, the بدون تغییر (No change) button stays disabled.
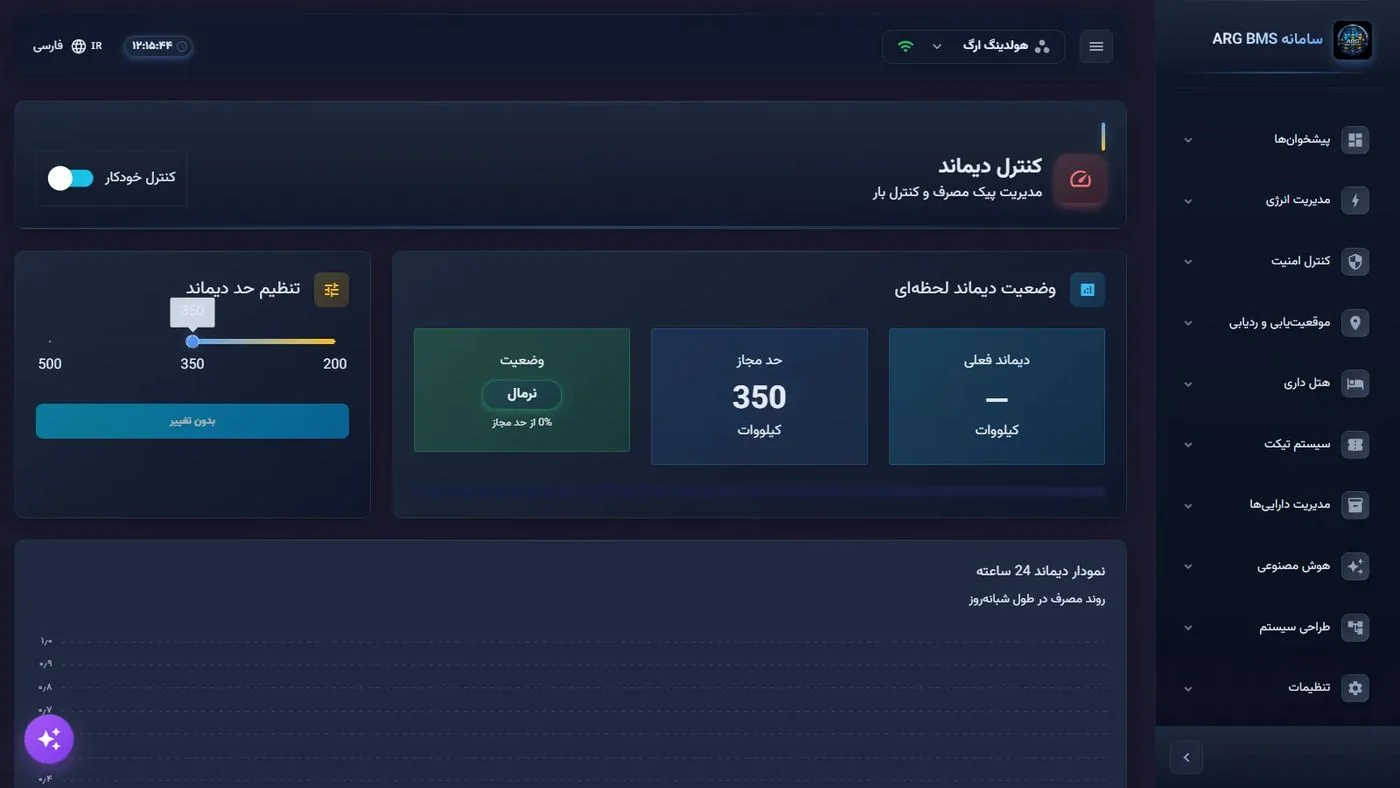
Demand control · "Automatic control" toggle, the three demand-status figures, and the limit slider with the "No change" button Note: In the current version the demand limit isn't saved on the server, and the کنترل خودکار (Automatic control) and اولویتبندی بارها (Load prioritization) toggles only take effect on this page; actually reducing load requires the logic engine (rules and scenarios). - Look at "Optimization" as a work list. The امتیاز بهینهسازی (Optimization score) card (out of 100), صرفهجویی ماهانه (Monthly savings), کاهش مصرف (Consumption reduction) and کاهش CO2 (CO2 reduction), together with the فرصتهای بهینهسازی شناسایی شده (Identified optimization opportunities) section with the اسکن مجدد (Rescan) and جزئیات (Details) buttons.
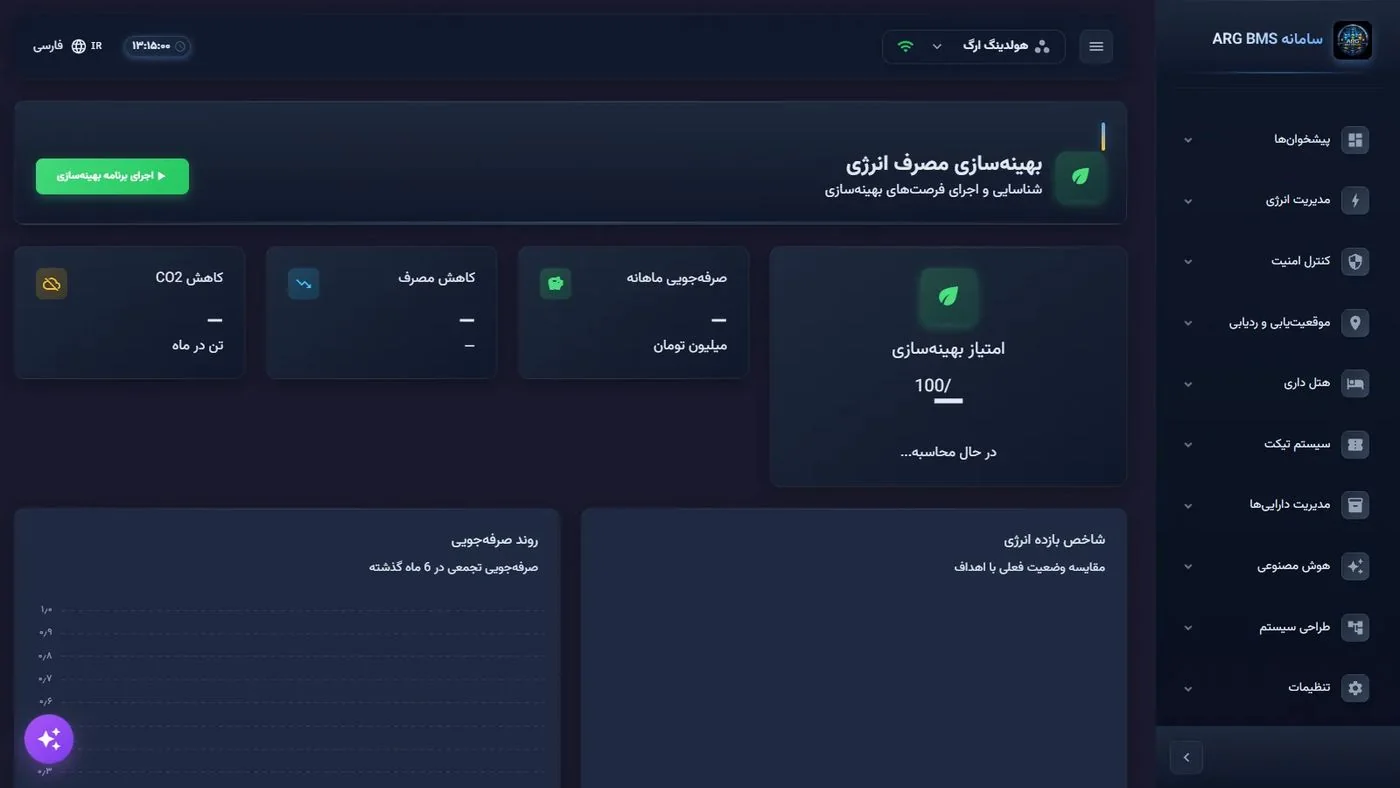
Energy-consumption optimization · Optimization-score card and three impact cards; two charts for the efficiency index and the savings trend
Common pitfalls
- Don't read "—" on a card as "no meter exists"; confirm a meter's existence from the وضعیت کنتورها (Meter status) table.
- Comparing two months is only valid when the same set of meters was active in both months; an inactive meter creates a false drop in consumption.
- Reducing demand isn't done by switching off load on the energy page; that's the job of the logic engine's rules and scenarios.
- In a presentation, stop the 5-second auto-refresh so numbers don't change mid-sentence.
- This group's export buttons (like دانلود گزارش (Download report) and خروجی Excel (Excel export)) don't produce a file in the current version; the list of working exports is in Lesson D5.
Summary
- The six energy pages cover the chain "measure ← analyze ← cost ← demand ← optimize".
- In the current version, the citable number comes from the "Meter status" table; the rest of the cards stay "—" until data is complete.
- Demand thresholds: 75% caution, 90% warning, 100% critical; the limit slider runs 200 to 500 kW in steps of 10.
- Cost has three tariff segments: off-peak, mid-peak, peak.
- Real load control is done through the logic engine, not the demand page's toggles.
Hands-on exercise on the live demo
An interpretive exercise on the public demo. Only look; don't delete or save any meter or setting.
- In پایش لحظهای stop the auto-refresh and write down the name and status of every meter you see in the وضعیت کنتورها table (if the table is empty, write that down as your finding and say what this project's energy report is missing).
- In کنترل دیماند assume current demand is 320 kW and the allowed limit is 400 kW; calculate and write down the percentage and status. (Answer: 80% ← "Caution")
- In مدیریت هزینه find the three sections کمباری, میانباری and پیک, and in two lines write down which loads in your organization could be shifted to reduce the peak share.
- In تحلیل مصرف change the period from "Monthly" to "Weekly" and write down which period is better suited for a board report and why.
Lesson check
Answer at least 3 of 4 correctly to pass.
- 1. In the current version, which section of the energy pages shows reliable live data?
- 2. In “Demand control”, if current demand is 92% of the allowed limit, what is the status?
- 3. What is the allowed range of the “Set demand limit” slider?
- 4. What are the three sections of “Cost breakdown by tariff”?