The digital twin at a glance, for executives
In ten to twelve minutes, understand what ARG Digital Twin is, what it replaces, and what value it creates for the organization — without going into technical detail.
«پیشخوانها» ← «دیدکلی» — «پیشخوانها» ← «دیدکلی» — «Dashboards» ← «Overview»
This lesson is written for executives who consume reports and overviews, not configuration. By the end you'll know what the digital twin replaces in your organization, what the system's work cycle is, and where to look in the demo to gauge its value in a few minutes.
What a digital twin is
ARG Digital Twin is a live digital version of a physical infrastructure: every real piece of equipment — chiller, UPS, server rack, pump, transformer, sensor — has a digital counterpart in the system that carries its live value, status, history, allowed limits and behavior rules. Users see these counterparts on 2D dashboards or 3D scenes, issue commands, receive alerts, and define automation logic without writing code.
The key difference from a 3D-visualization product is exactly here: the 3D model is just a shell; the real value is in the live connection of every object to a real point, that point's allowed limit, its alerts, and its automatic response.
Which environments and who for
- Smart buildings and office/commercial complexes: HVAC, lighting, elevators, parking, safety
- Data centers and server rooms: racks, power, cooling, UPS, temperature and humidity
- Substations and distribution networks; process and water facilities; fuel stations, warehouses, industrial sites, hotels and greenhouses
The system's everyday users fall into five groups: facility and operations managers (overview, alerts, reports), control-room operators (live dashboard and secure command confirmation), automation and network engineers (connecting equipment and mapping points), energy and asset managers (metering, tariffs, cost, upkeep), and integration teams.
The system's work cycle — six stages
| Stage | What happens |
|---|---|
| 1 · Connect | Equipment connects to the system using its own protocol |
| 2 · Model | Every point gets a unique id and a control variable with a unit, scale and limits |
| 3 · Monitor | Real-time values appear on dashboards and history is stored |
| 4 · Alert | Crossing a limit, a disconnect, or stale data generates an alert and a notification |
| 5 · Automate | Rules, schedules, scenarios and state machines provide an automatic response |
| 6 · Control | An operator or the logic sends a command; it executes with secure confirmation and an equipment receipt |
These six stages are also the order a project is deployed in; Lesson D5 turns this same cycle into six execution steps with a defined output for each.
Capabilities at a glance
- 10 industrial and IT protocols in one core
- 22 organizational modules (energy, security, assets, ticketing, production, hospitality, tracking, and more)
- 4 dashboard types: 2D, 3D, list and map
- 5 no-code automation mechanisms and 4 notification channels with an escalation policy
- More than 3,600 equipment models from over 770 brands in the catalog
- 6 interface languages with full right-to-left support
What it replaces
| Topic | Traditional BMS / SCADA | ARG Digital Twin |
|---|---|---|
| Connecting equipment | Dependent on a single protocol or brand | 10 protocols in one core; a catalog with ready-made points |
| Display | Fixed graphic screens | A 2D designer and 3D builder with every object live-linked to a point |
| Automation | Specialized programming | No-code rules, scenarios and state machines, with a test lab |
| Intelligence | Fixed reports | A smart assistant that acts only after user confirmation |
| Organizational scope | Facilities only | Energy, security, assets, ticketing, production, hospitality, tracking, and more |
| Multi-tenancy | Separate install per site | One installation, many projects, with full data isolation |
| Integration | Files or a limited interface | A documented standard API, a real-time channel and event webhooks |
| Language | English | 6 languages with true right-to-left support |
| Deployment | Dedicated hardware | Windows, Linux, Docker or cloud |
Step by step
- Sign in and see the project. The current project's name is shown in the top bar (in the demo: هولدینگ ارگ (ARG Holding)). Every project has its own data, and switching projects changes every page. Then open «پیشخوانها» ← «دیدکلی» (Dashboards ← Overview).
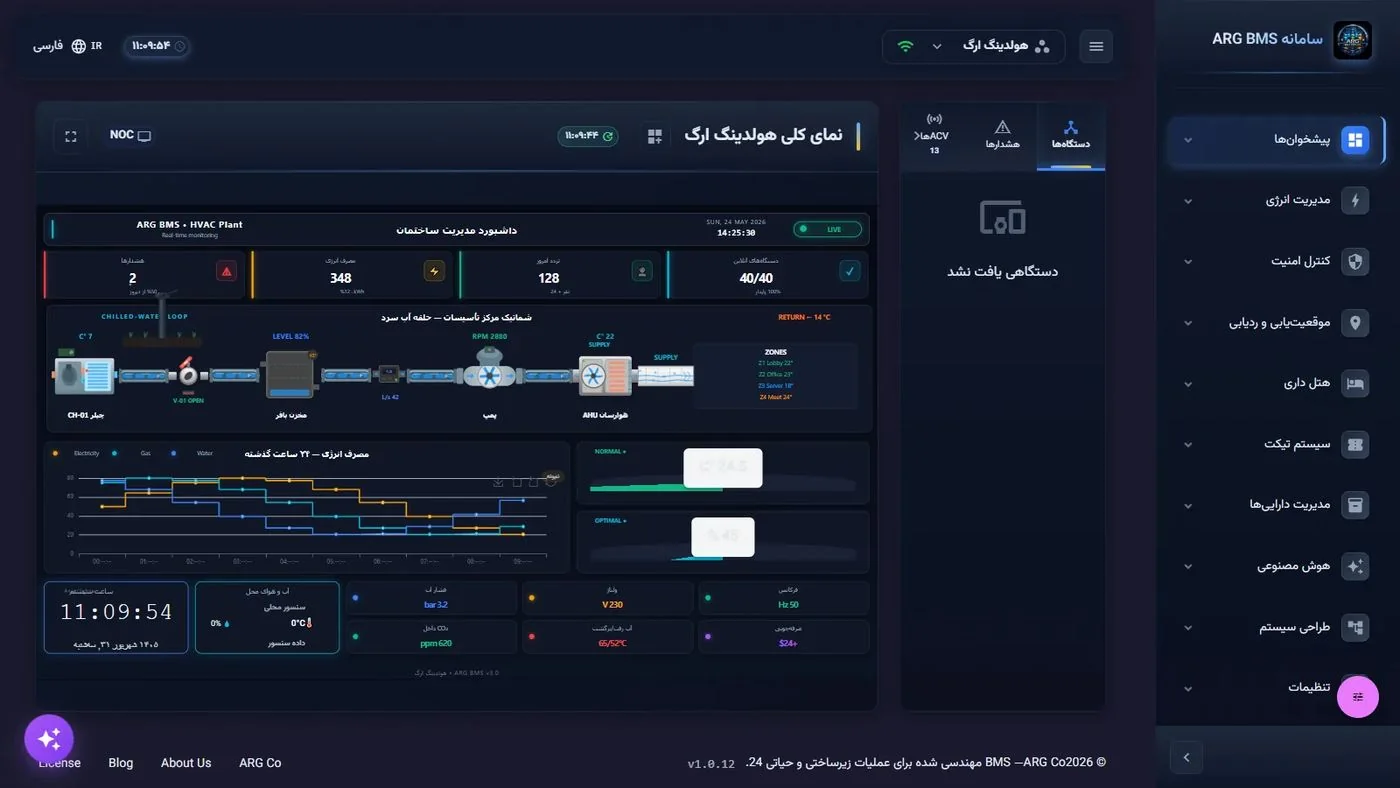
Holding overview · Dashboard header, update-time chip, "NOC" and "Full screen" buttons; a three-tab sidebar on the left - Read the counters at the top of the dashboard. In this example there are four counters: هشدارها (Alerts), مصرف انرژی (Energy consumption), تردد امروز (Today's traffic) and دستگاههای فعال (Active devices). These numbers aren't static; each is tied to a real point and updates as the equipment's value changes.
- Follow a process schematic. In the middle of this same dashboard, the chilled-water loop from the chiller to the air handler is shown with temperature, pump speed and valve status. For an executive, the value of this section is "seeing the causal chain": which upstream equipment is causing a downstream condition.
- Open a 3D twin. Click the انتخاب داشبورد (Select dashboard) icon in the header and pick one of the 3D scenes. The corner of the scene shows the object count and the count of connected points; these two numbers are exactly what separates a "mockup" from a "twin".
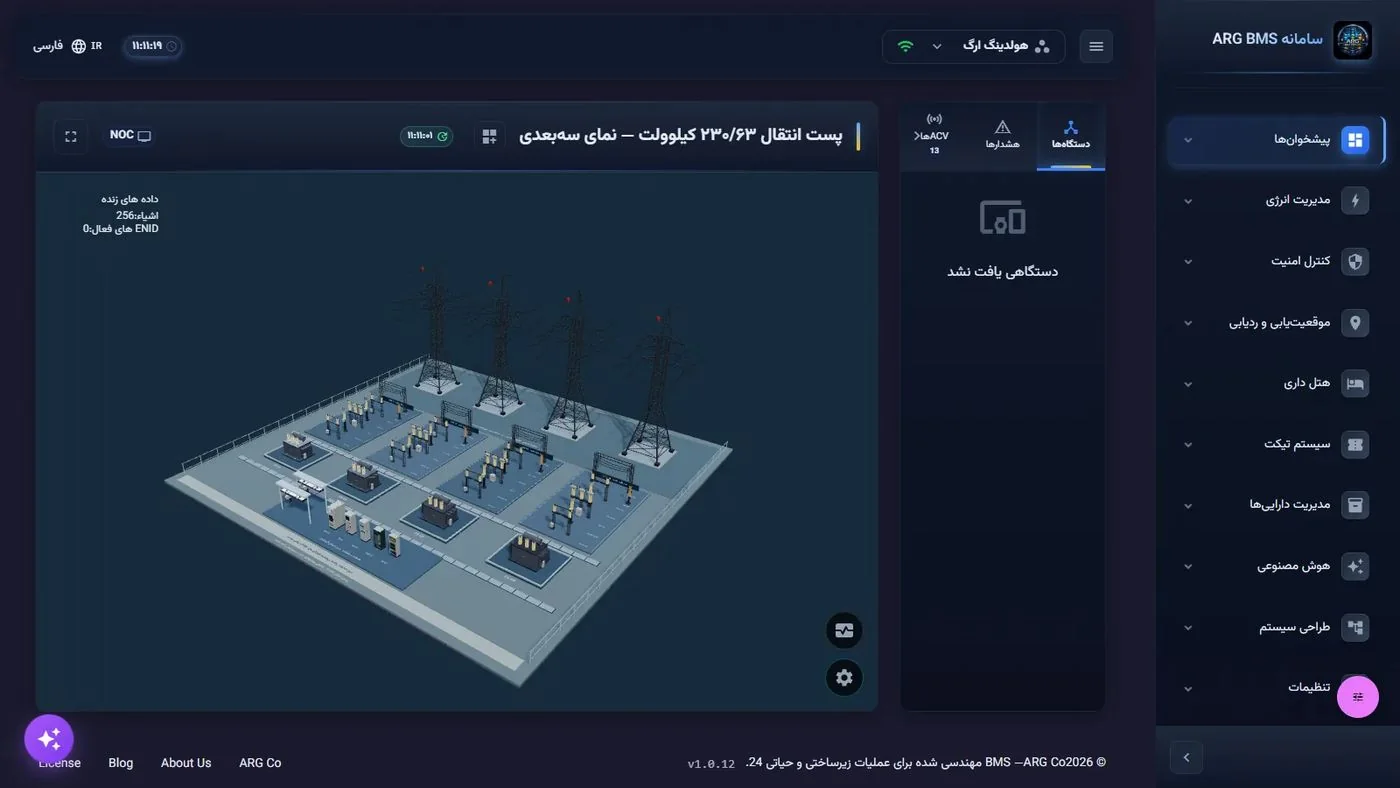
230/63 kV substation · "Live data" label in the top corner: the scene's object count and active point count - Skim the organizational scope. In the sidebar just look at the group names: مدیریت انرژی (Energy management), کنترل امنیت (Security control), موقعیتیابی و ردیابی (Positioning and tracking), هتل داری (Hospitality), سیستم تیکت (Ticketing system), مدیریت داراییها (Asset management), هوش مصنوعی (Artificial intelligence), طراحی سیستم (System design). This list is the same "Organizational scope" row from the comparison table.
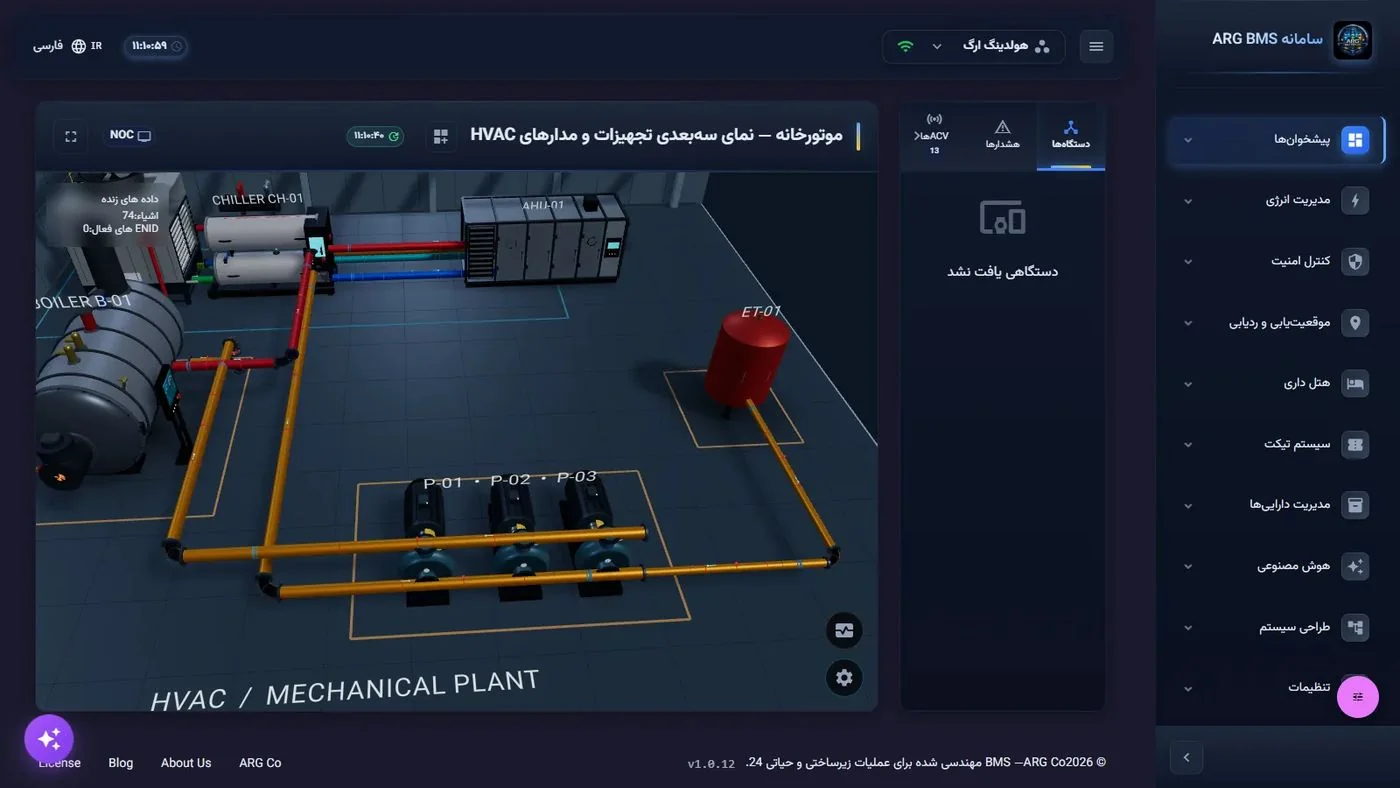
Boiler room · Supply and return circuits with color coding and equipment labels 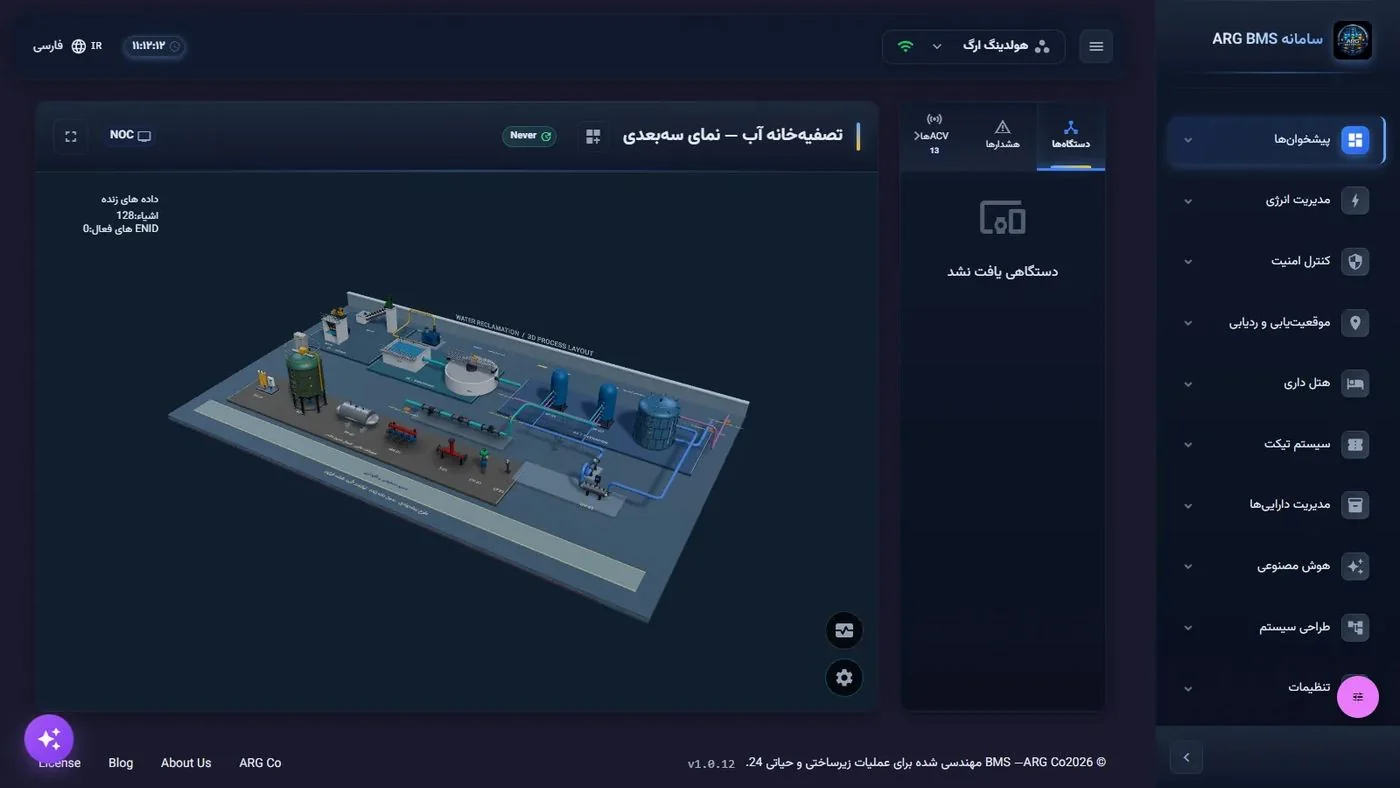
Water treatment plant · A full process layout in a single scene - Try the control-room display mode. The NOC button switches the display to video-wall mode, and تمام صفحه (Full screen) removes the margins. For a management session or a control-room display, these two buttons are enough.
Common pitfalls
- Don't equate a "digital twin" with a "3D model"; the yardstick is the number of connected points and alert behavior, not how nice the scene looks.
- Every dashboard has its own indicators; there is no single global indicator. If you don't see a number on one dashboard, that dashboard simply isn't connected to that point.
- Some organizational-module pages show empty ("—") until project data is entered; this isn't a sign of a fault. Details in Lessons D3 and D4.
- Don't quote the "Capabilities at a glance" numbers in negotiations as a project commitment; project scope is set at the discovery step.
Summary
- Digital twin = a live counterpart of every piece of equipment, with a value, status, history, limit and rule.
- Work cycle: connect ← model ← monitor ← alert ← automate ← control.
- Main difference from traditional systems: multiple protocols in one core, no-code automation, an organizational scope beyond facilities, and one installation serving many projects.
- For a ten-minute assessment: "Overview" ← counters ← a 3D scene ← NOC mode.
Hands-on exercise on the live demo
On the public demo (bms.argsrv.com, the "ARG Holding" project) only look and interpret; don't change any existing data and don't delete anything.
- From پیشخوانها (Dashboards) ← دیدکلی (Overview), using the انتخاب داشبورد (Select dashboard) icon, open three different dashboards: an executive overview, a technical dashboard (for example cooling or a data center), and a 3D scene.
- For each one, write one sentence: which management decision this page supports and who its main audience is.
- For each one, name a row from the "What it replaces" table that this page demonstrates.
- In the 3D scene, note the object count and the active point count, and say whether this scene is more of a "mockup" or a "twin".
Lesson check
Answer at least 3 of 4 correctly to pass.
- 1. Which definition matches the product documentation?
- 2. What is the correct order of the system's work cycle?
- 3. “One installation, many projects, with full data isolation” answers which limitation of traditional systems?
- 4. Compared with traditional systems, how is automation defined in this system?