The executive dashboard and its indicators
Open the overview dashboard, move between dashboards, correctly read counters and online/offline status, use control-room display mode, and know which numbers are reliable and which are estimates.
«پیشخوانها» ← «دیدکلی» و «پیشخوانها» ← «داشبوردهای لیستی» — «پیشخوانها» ← «دیدکلی» و «پیشخوانها» ← «داشبوردهای لیستی» — «Dashboards» ← «Overview» and «Dashboards» ← «List dashboards»
The dashboard is the executive's first page. This lesson teaches exactly what to look at on this page: which chip says the data is fresh, which tab shows this dashboard's own alerts, and which cards are estimates that shouldn't be the basis for a decision.
Get to know the page
The dashboards menu group is called پیشخوانها (Dashboards) in the Persian interface and has two main items for executives: دیدکلی (Overview) and داشبوردهای لیستی (List dashboards).
| Control | Where | What it does |
|---|---|---|
| Dashboard title | Main card header | Name of the current dashboard; if no title is set, the project name is shown |
| انتخاب داشبورد (Select dashboard) | Icon next to the title, and also the floating buttons | Switch between the project's dashboards; your choice is remembered for next time |
| Time chip | Next to the title | Time of the last data update; if it reads Never, no data has been received yet |
| NOC | Header | Control-room mode for a video wall (button tooltip: "NOC mode" / "Exit NOC mode") |
| تمام صفحه (Full screen) | Header | Removes the margins; exit with the same button or the Esc key |
| Sidebar | Left side of the dashboard | Three tabs: دستگاهها (Devices), هشدارها (Alerts), ACVها (ACVs) |
| Floating buttons | Bottom of the page | The "Dashboard controls" menu: select dashboard, show widgets, sidebar, charts, quick access, NOC mode, refresh |
The دستگاهها tab has a search box and three filter chips, همه (All), آنلاین (Online) and آفلاین (Offline). An important point for interpretation: this sidebar only shows devices that this dashboard is connected to, so its number is not "the whole organization".
If "show top widgets" is on in the dashboard settings, you'll also see a row of ready-made cards: دستگاهها (Devices), آلارمهای فعال (Active alarms), محیط زیست (Environment), مانیتور انرژی (Energy monitor), کنترل تردد (Access control), وضعیت شبکه (Network status), ذخیرهسازی (Storage), آب (Water), امنیت (Security) and برق (Power); each card also shows a trend of "increasing", "decreasing" or "steady".
The four dashboard types and where they're useful
| Type | How it's built | Executive use |
|---|---|---|
| 2D | Freely designed in the dashboard designer | Executive overview, process schematic, a unit's key indicators |
| 3D | A scene built in the 3D builder | Meetings and presentations, onboarding new team members, understanding a site's physical layout |
| List | Automatic, from the project structure, with no design work | Organizational roll-up and online/offline counts at every level |
| Map | Equipment and sites plotted on an online or offline map | Multi-site organizations and scattered assets |
For an executive, choosing the right dashboard type matters as much as its content: a 3D dashboard is excellent for presenting and training, but for daily follow-up, the 2D and list views are faster. An organization typically needs three categories of dashboard: an executive view (a few indicators, no detail), an operational view (broken down by system), and a control-room view (video wall, NOC mode).
Step by step
- Open the executive dashboard. «پیشخوانها» ← «دیدکلی», then use the انتخاب داشبورد icon to pick the organization overview.
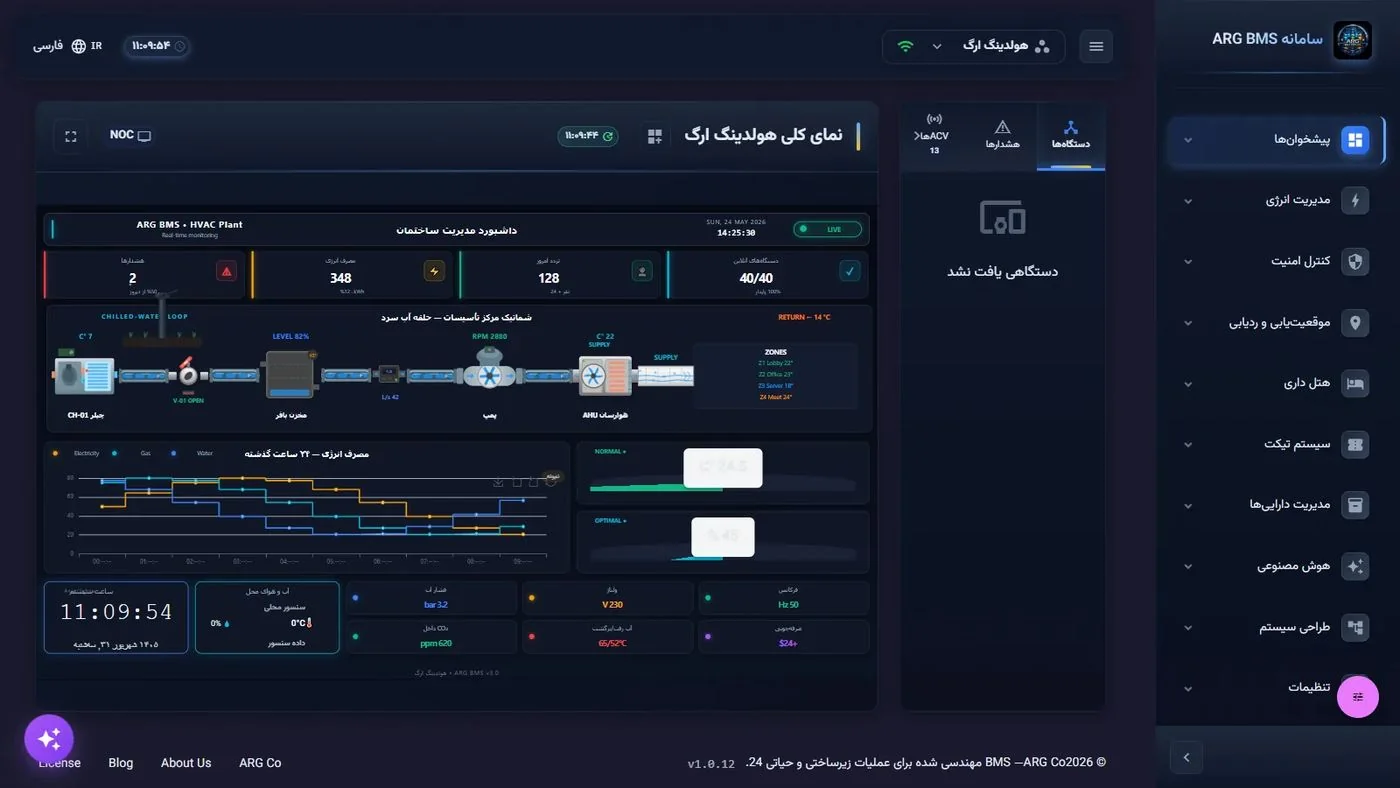
Holding overview · Four counters at the top of the page, the chilled-water-loop schematic, and the past-24-hours consumption chart - Gauge how fresh the data is. Before interpreting anything, look at the time chip next to the title. A stale time or
Nevermeans the numbers on the page shouldn't be the basis for a decision; it's an equipment-connectivity issue, not a dashboard issue. - See this dashboard's own alerts. In the sidebar open the هشدارها tab. To count disconnected devices, go to the دستگاهها tab and click the آفلاین chip.
- Open the display controls. The floating button at the bottom of the page opens the کنترل های داشبورد (Dashboard controls) menu; from here toggle the top widgets, sidebar, charts and دسترسی سریع (Quick access) on or off, and بازخوانی (Refresh) re-reads the data and the dashboard's configuration.
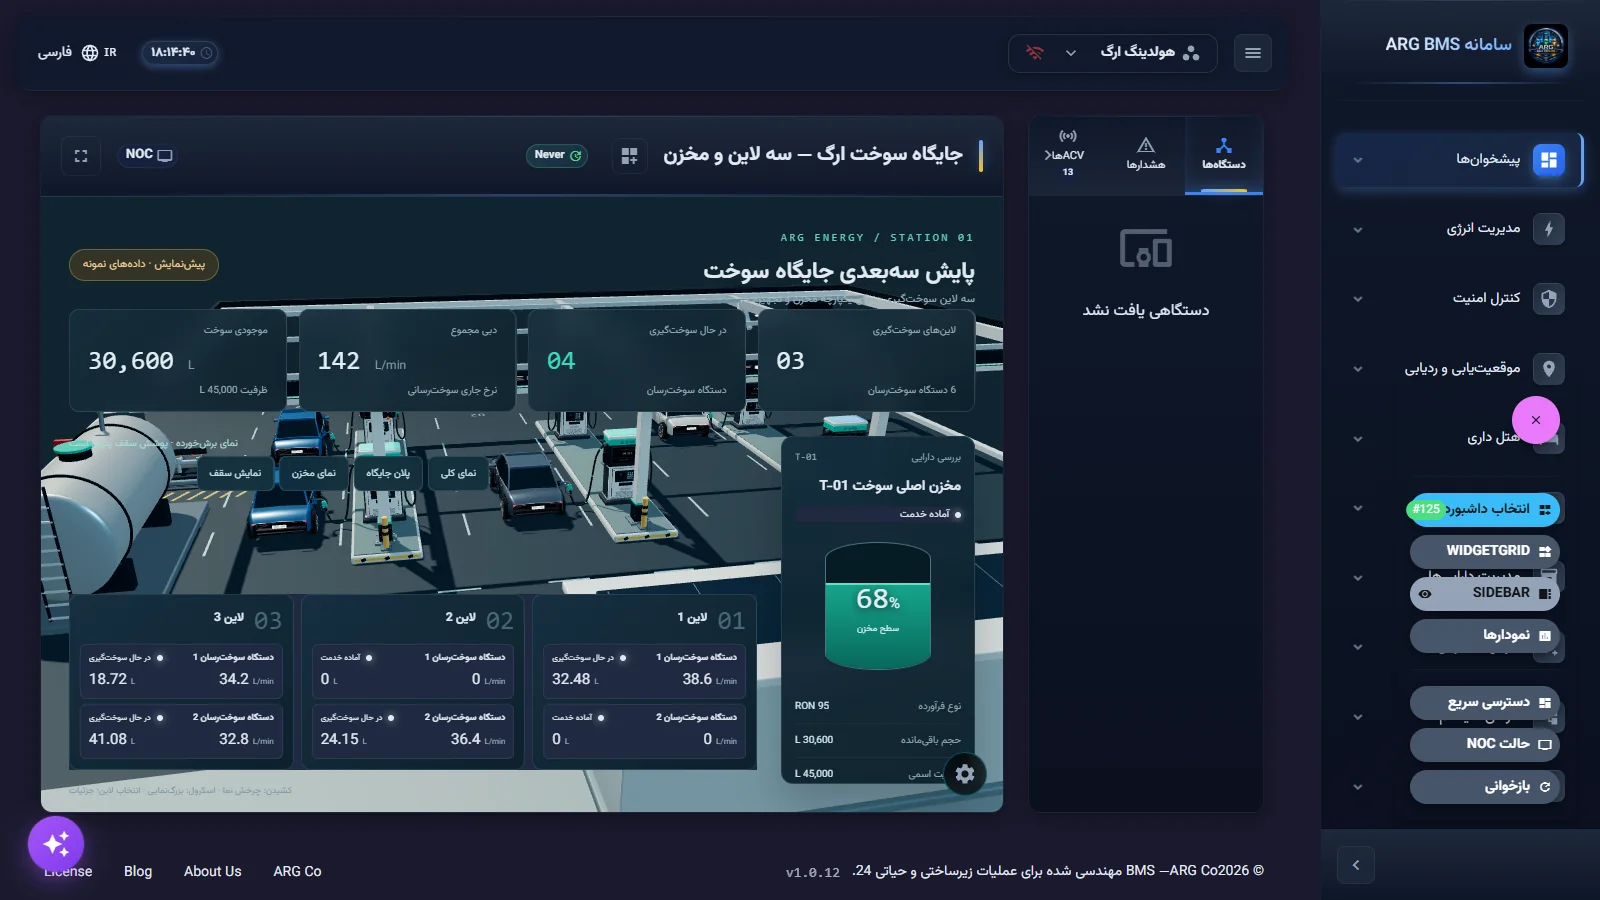
Dashboard controls menu · Row of floating buttons and each one's name; a few labels are still in English - Read a technical dashboard with the same eye. The data-center overview places the Active Alarm, Total IT Load and PUE cards side by side; for an executive, these three together mean "load, efficiency and risk".
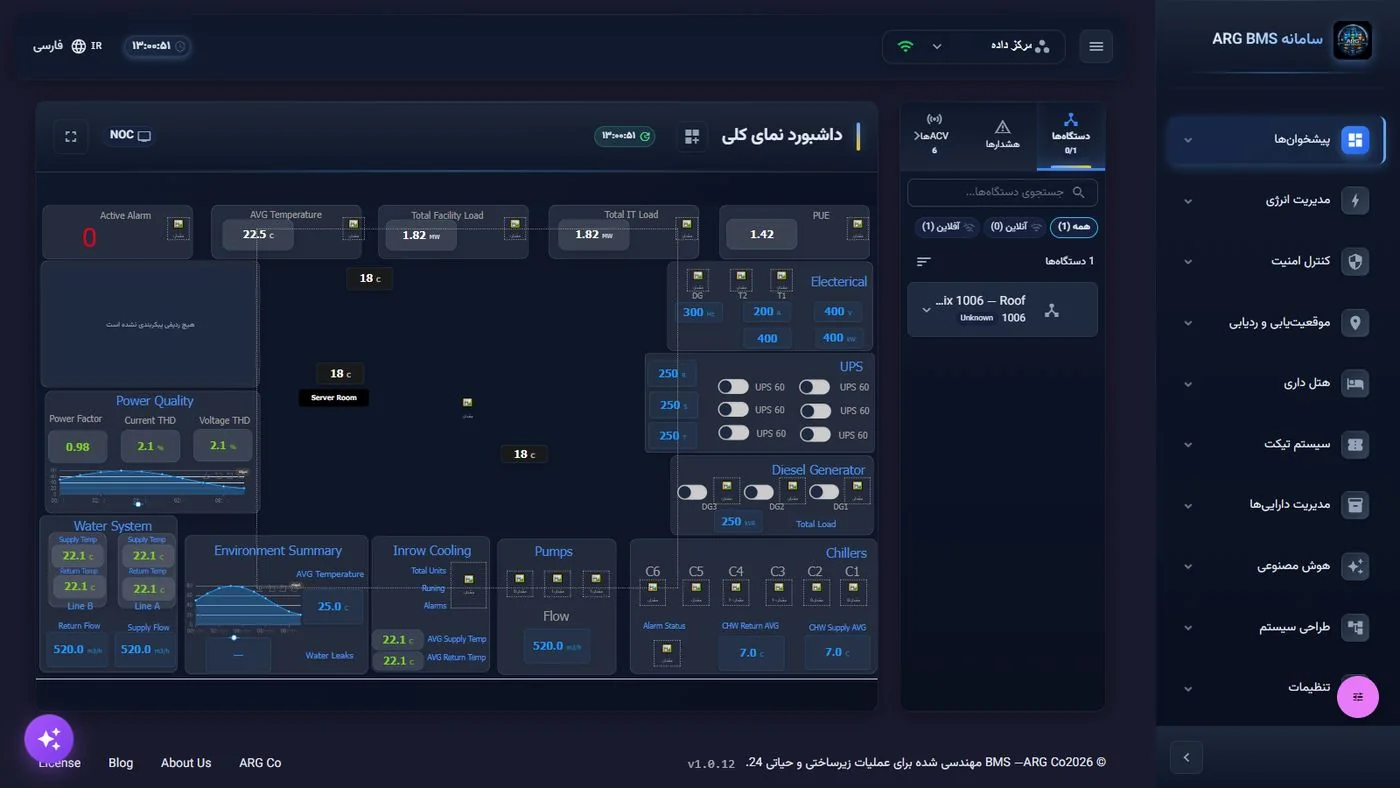
Data-center overview · Active Alarm, AVG Temperature, Total Facility Load, Total IT Load and PUE cards in one row - Take the data-quality label seriously. On operational views, you may see داده موجود نیست (No data available) instead of a number. The system deliberately never shows a zero or a fabricated number; "—" means no valid value is available.
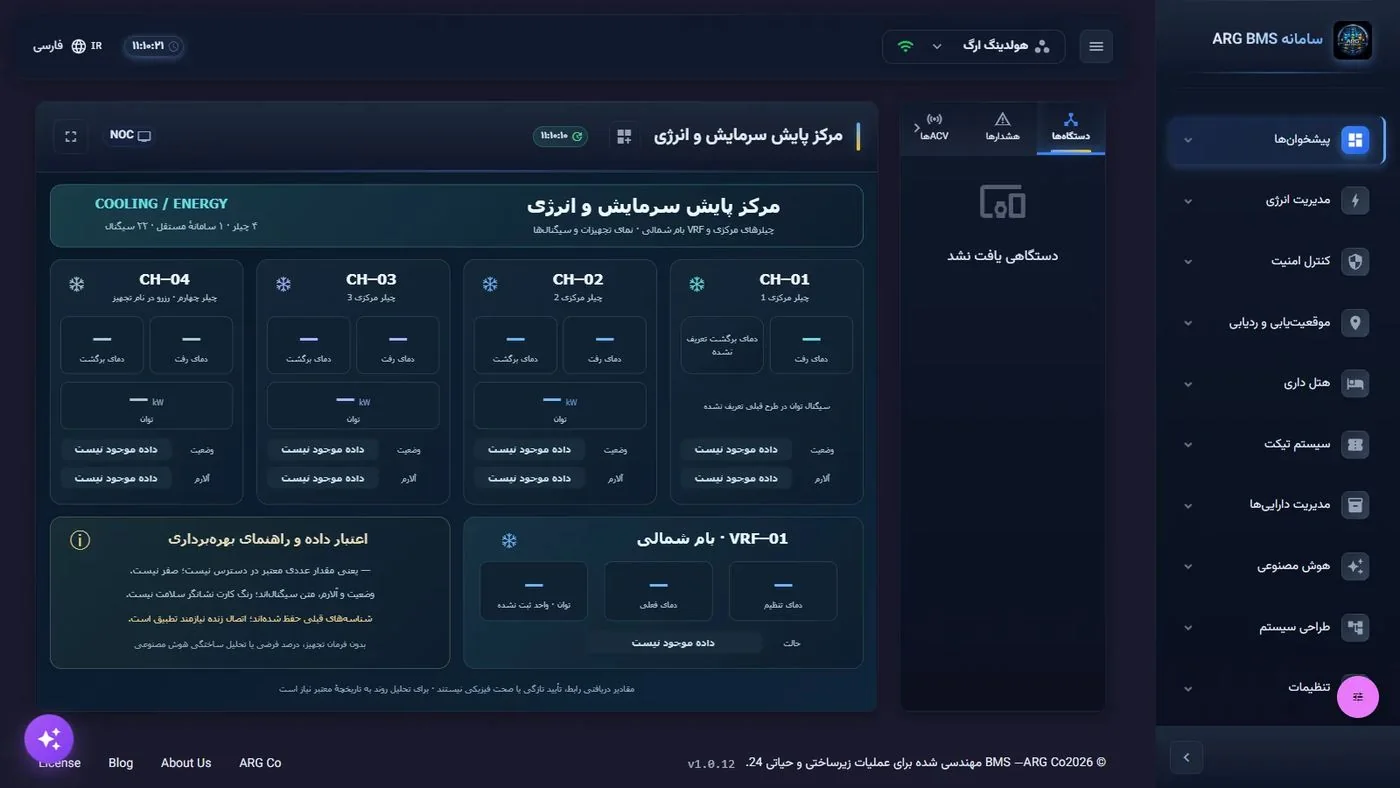
Cooling and energy monitoring center · A "data validity and operating guidance" box and "No data available" chips on the chiller cards - Review the organizational structure with the list view. «پیشخوانها» ← «داشبوردهای لیستی», then in the انتخاب نوع نمایش (Select display type) card click ساختار پروژه (Project structure) and drill down from organization to building, floor and space. At every level, the مجموع (Total), آنلاین (Online), آفلاین (Offline) and آلارم (Alarm) figures are shown.
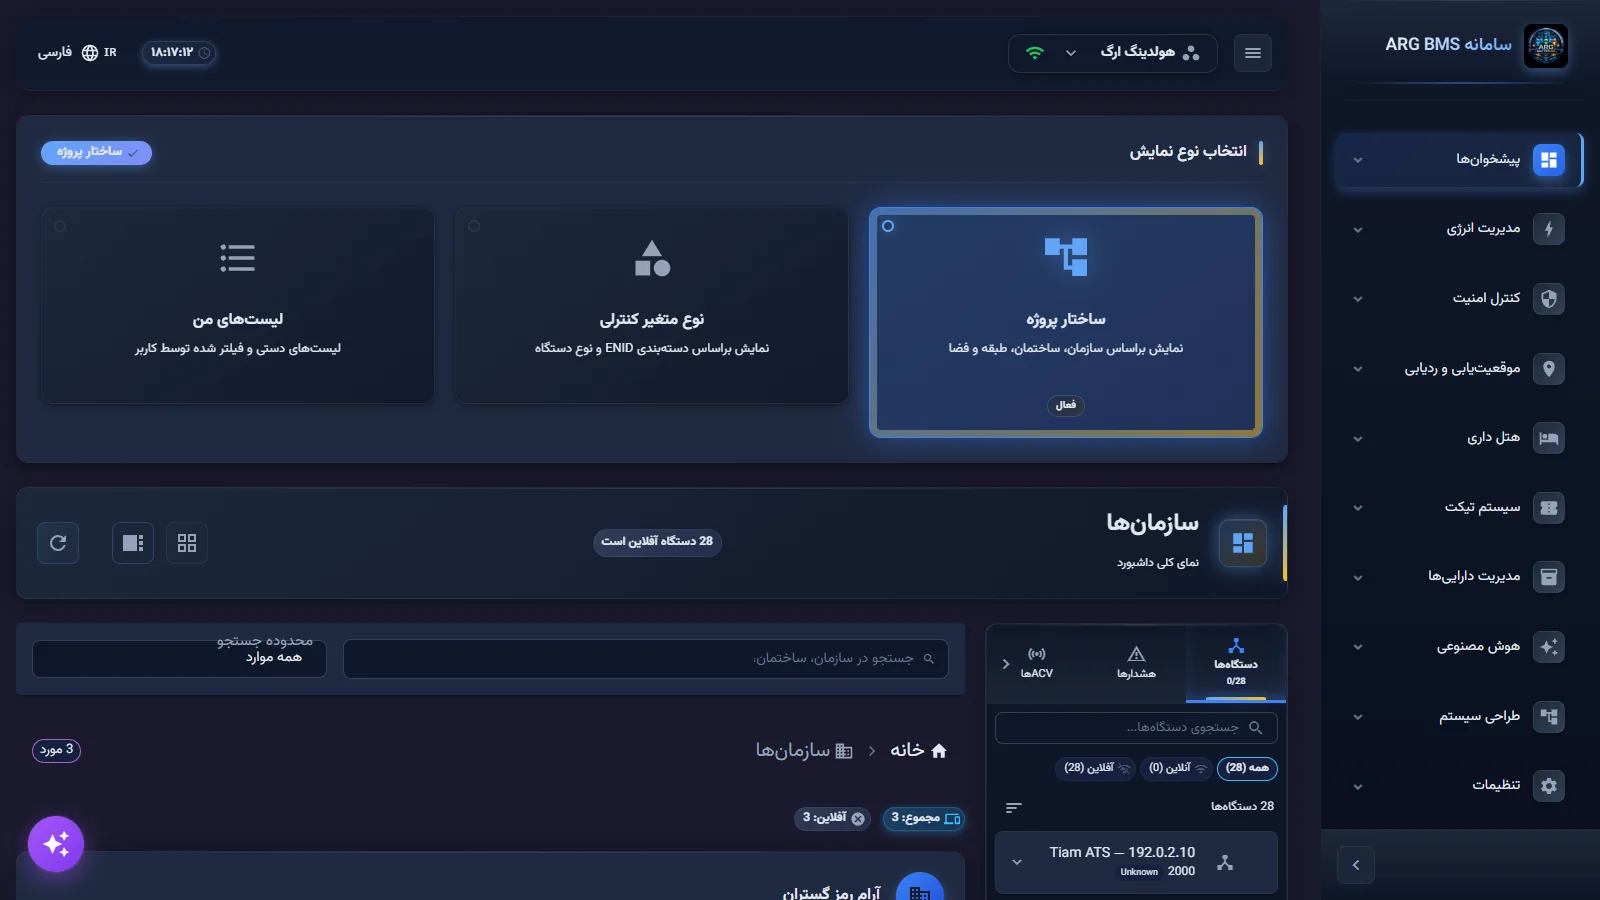
List dashboard, project-structure view · The "Select display type" card, the current level's title, and online/offline/alarm chips - Control-room mode. Click NOC and then تمام صفحه; exit with the same button or Esc.
Common pitfalls
- The
Neverchip means "no data has arrived yet", not "the dashboard is broken". - A dashboard not connected to any point shows "No devices found" in the sidebar; this is normal.
- The ذخیرهسازی (Storage) and وضعیت شبکه (Network status) cards, and the cost estimate on the مانیتور انرژی (Energy monitor) card, hold sample or estimated values in the current version; don't rely on them for a financial decision — see Lesson D3.
- The sidebar's number is scoped to that one dashboard; for an organization-wide figure use "List dashboards" at the organization level.
- Several floating-button labels are still in English; know beforehand, in a presentation, what each button does.
- The View Reports card in the "Quick access" section doesn't lead to a reports page in the current version; the real exports are listed in Lesson D5.
Summary
- Correct viewing order: data freshness ← alerts ← counters ← detail.
- The sidebar's three tabs are Devices, Alerts, ACVs — and their scope is just this dashboard.
- "List dashboards" is built automatically from the project structure with no design work, and is better suited to organizational roll-ups.
- NOC and full screen are for a video wall; these preferences are local to the browser.
- Some of the ready-made cards at the top of the page are estimates and are not the basis for a financial decision.
Hands-on exercise on the live demo
A "look and interpret" exercise on the public demo (the "ARG Holding" project). Don't change, save or delete anything.
- On دیدکلی open the overview dashboard and note three things: the update-time chip, the number of active alerts, and the number of online and offline devices in the دستگاهها tab.
- Turn on NOC mode and then تمام صفحه, and exit again.
- Go to داشبوردهای لیستی, pick the ساختار پروژه view, and find the same online/offline figures at the organization level. In two lines, explain why these figures might not match the dashboard sidebar's number.
- Open a technical dashboard and name two cards whose numbers can be cited for a management decision, and one card that can't, with the reason.
Lesson check
Answer at least 3 of 4 correctly to pass.
- 1. Which English gloss does this lesson use for the Persian dashboards-menu-group label?
- 2. Which tabs does the “Overview” sidebar have?
- 3. The time chip next to the dashboard title shows Never. That means:
- 4. In “List dashboards”, which display type is based on organization, building, floor and space?